Statistical Significance Testing (SST)
Statistical significance tests differentiate material effects from random noise in data, but their results are influenced by sample size and must be interpreted as ranges rather than point estimates. Practical significance often requires subjective judgment beyond statistical significance.
THE IDEA
Operational Data
Broadly defined, operational data encompass recordings of the routine functioning and activities of a business organization. As can be expected given the wide array of types and sizes of business entities, the makeup and the diversity of operational data can vary rather significantly across organizations. However, considering that all business organizations ultimately exist to produce and/or deliver products or services to customers, when abstracted beyond the specificity of an individual entity, operational data share some general characteristics: Those data usually include transactional details, descriptive and control indicators, flags and counters sourced from multiple electronic interchange systems and divided across numerous tables and files. When considered from informational point of view, operational data are generally captured as a passive (i.e., recording all manner of system details on ongoing basis) by-product of the modern electronic transaction processing and communication infrastructure, which just about guarantees that captured data are a mix of informative metrics (sometimes referred to as ‘signal’) and non-informative noise, which encompasses anything ranging from incorrect to meaningless details. Moreover, when considered from the point of view of decision-making, data-encoded past is not a perfect predictor of the future, in the sense that past behavioral patterns are only somewhat, though rarely, if ever, fully indicative of future behaviors.
When considered jointly, those two important characterizations of operational data suggest that evidence derived from analyses of those data is probabilistic in nature, as illustrated in Figure 7.4. When thought of as methodological means of extracting insights out of data, probabilistic analyses can be either exploratory or confirmatory. The former, often also characterized as data mining, encompass all analyses seeking to uncover potentially meaningful patterns or relationships, without being guided by any preexisting assumptions or beliefs. The latter encompass any analyses focused on testing preexisting beliefs, commonly utilizing a set of procedures falling under a general umbrella of the scientific method, consisting of systematic observation, measurement, and the formulation, testing, and modification of hypothesis.

FIGURE 7.4 Extracting Evidence from Operational Data.
At the point of insight extraction, both the exploratory and confirmatory analyses make use of statistical significance tests (SSTs), which are analytic tools designed to differentiate between material and spurious effects. Depending on the type of comparison (e.g., sets of frequency counts, such as the number of vehicular accidents, or mean differences, such as the average cost of vehicular accidents), SSTs utilize one of the distributionally defined statistical tests, such as χ2, F-, or t-test, to determine whether observed differences (e.g., the frequency of accidents in Region A and Region B) are materially different, or if those differences are due to random fluctuations and thus not material, which means they are not expected to recur in the future. While the underlying statistical tests are themselves methodologically sound, the testing procedure suffers from consequential limitations, with sample size dependence being one of the more pronounced problems, at least in the realm of organizational data analyses. As noted earlier, the number of records used in analyses (i.e., the sample size) and the likelihood of detecting statistically significant effects are highly correlated, so much so that at a moderately large sample size even inordinately trivial differences can become statistically significant, while not being statistically significant at a smaller sample size (everything else being the same). In terms of detecting practically material insights, which typically entails a relatively large number of records,6 tests of statistical significance are not able to meaningfully differentiate between practically material and trivial effects (see Chapter 6). This is indeed a worrisome limitation, especially considering that in the age of big data sample sizes tend to run quite large, and practically trivial but statistically significant effects are commonplace.
A yet another important consideration is somewhat more obtuse, manifesting itself in terms of precision of estimates and the nature of generalizability. Without delving into esoteric technical details, these two considerations embody the conflict between the business practitioners’ informational needs and the methodological limits of SST, which are best illustrated using a simple example. Let us say that an insurance company’s claim manager wanted to determine the magnitude of the difference between the average cost of an auto accident for Location A and Location B, and also wanted to ascertain that the said difference was statistically significant. Having compiled the requisite data, the manager then computed the average (mean) auto accident costs for each of the two locations, which we will assume were $2,995 for Location A and $3,405 for Location B, following which she selected the appropriate SST (in this case, the t-test) to assess whether or not the observed difference between the two means was also statistically significant.7 The results suggested that the difference between the average cost Location A and Location B auto accidents was indeed statistically significant, based upon which the manager concluded that the observed difference of $410 ($3,405–$2,995) was material, that is, expected to recur going forward.
This is a fairly common example and it illustrates a rather common misuse of SSTs. The most glaring flaw in that reasoning is that statistical significance cannot be attributed to exact quantities, technically known as ‘point estimates’. Again, without delving into technical details, SSTs have the power, subject to sample size limitations outlined earlier, to estimate whether the observed difference between two or more means or frequencies is greater than the difference that could be expected to arise by chance if, and only if, that difference is expressed as a range, rather than an exact value.8 The reason for that is that the two location-specific averages were estimated using subsets or samples of all claims, and since all sample estimates are somewhat imprecise (which is captured in the statistical measure of ‘standard error’), the degree of that imprecision needs to be factored into the estimate of the magnitude of the difference between the two means (the same logic applies to comparisons of more than two means and to frequencies). Given that, to be able to qualify the difference between the two location-specific average claim costs of $3,405 and $2,995, the originally point estimate-expressed quantity of $410 ought to be re-expressed as a range that accounts for the standard error of the mean, which is a statistical measure of the relative imprecision of sample estimated means. Assuming a standard error of $45, the commonly used 95% confidence interval would yield an estimated range of $321.8–$498.2, in which case the claim manager could conclude that there is 95% probability that the difference between average cost of auto claims was somewhere in the $321.8 to $498.2 range.9 Clearly, it is less managerially compelling to characterize the difference between Locations A and B average auto accident costs in that manner, but only so-expressed magnitude can be ascribed statistical significance.
The sample size and confidence-level-related challenges point to a fundamental question of why is the notion of statistical significance important in the first place. While in applied business analytics it is often used as an indication of importance or attention worthiness of data analytic findings, statistical significance testing is merely a mechanism for attesting to non-spuriousness or nonrandomness of sample-derived estimates. Much like the term ‘error’, as in the earlier mentioned standard error, should be interpreted to mean ‘deviation’ rather than a ‘mistake’ in the context of statistical analyses, the term ‘statistical significance’ should be interpreted as conveying ‘nonrandomness’ rather than ‘importance’. Additionally, the level of significance (with the three commonly used ones being 90%, 95%, and 99%) aside, tests of significance are strictly pass-fail thus are insensitive with regard to the ‘degree of’ significance (to be clear, that is the case within a chosen level of significance, such as 95%; using a higher level of significance, such as 99%, will result in a higher degree of significance). So, if 95% level of significance is chosen, all effects that pass that threshold are deemed equally statistically significant, regardless of any magnitudinal differences.
The above often compels analysts to draw a line of demarcation between the ‘statistical’ and ‘practical’ significance, as a way of differentiating between practically material and practically trivial findings. Let’s pause for a minute: Isn’t there something troubling about the manifestly quantitative SSTs having to be more or less subjectively qualified to become of value to users of the resultant insight? Though widespread, that practice stands on a shaky logical and methodological foundation. It is troubling that the manifestly objective task of differentiating between informationally worthwhile and trivial data analytic findings is ultimately subverted by largely subjective considerations, some of which are permeated by the very cognitive biases that objective data analyses aim to overcome.
It is important to keep in mind that while SSTs can and do serve an important hypothesis testing role, those tests are not always necessary, or even appropriate in applied business analyses. Unless it is important to show evidence of sample-to-population generalizability, significance tests may be plainly superfluous – sometimes the difference is what it is, and no generalizability validation is necessary. At the same time, when the use of those tests is warranted, it is important to make sure that they are used in the manner that leads to valid and reliable conclusions.
Exploratory Analyses
Any search for informationally meaningful patterns or relationships hidden in data falls under the broad umbrella of exploratory analyses. As a general rule, those methods are geared toward creation of new knowledge by means of uncovering previously unknown relationships; the earlier discussed SSTs play a pivotal role in those efforts, supplying means of differentiating between persistent and spurious findings. In view of the rich and continuously expanding diversity of data sources and types, there are numerous exploratory data methods that are available, ranging from classical descriptive statistics to automated data mining, with the latter encompassing numeric and text data mining tools.
Approach- and tool-wise, data exploration can range considerably from relatively simple analyses of small datasets to complex analytic undertakings encompassing large quantities of structured and unstructured source- and type-heterogeneous data. The former often make use of simple tools such as Excel to generate numerically expressed insights or Tableau to produce visual summarizations, whereas the latter typically utilize analysis-oriented programming languages such as R or Python, or sophisticated data analytic applications such as SAS or SPSS. Although the more in-depth operational coverage of the ‘what, how, and why’ of exploratory analyses falls outside of the scope of this book, the general process shared by different approaches is summarized in Figure 7.5.

FIGURE 7.5 High-Level View of Exploratory Data Mining.
The first step in any exploratory analysis is to carefully select data to be used. While that is rather intuitively obvious, in practice it may be more involved than one might expect because what constitutes appropriate – in view of the informational need at hand – data is not always clear due to factors such as knowing what data is available, how it can be accessed, etc. That can be particularly challenging in large organizations, many of which actively capture and store lots of different data but rarely invest in comprehensive, centrally maintained data reference and access resources. Moreover, as organizations continue to struggle with finding the optimal data security vs. data access trade-off, the ever-present threat of unauthorized data breaches tends to push organizational data keepers to err on the side of tighter data security, which inescapably makes broader organizations ‘getting to know’ the available data more challenging. And so though conceptually trivial, the practical task of identifying the most informationally promising data can be far more involved than expected.
Once selected, data need to be reviewed for completeness and accuracy, with an eye toward correcting for any observed deficiencies. Broadly referred to as data cleansing, those activities encompass variable-by-variable value assessment and missing value imputation, data feature re-engineering which often includes variable re-coding, combination and indicator creation, and record aggregation, which is typically necessitated by ‘one-to-many’ data structures, as exemplified by customer purchase data where multiple records can reflect purchases of a single customer.10 Moreover, data cleansing can be computationally and otherwise complex, requiring considerable data manipulation and programming skill, especially if data are pooled from multiple sources (i.e., there are multiple data files, each requiring separate processing, but ultimately expected to yield a single analytic dataset).
Given that the vast majority of operational data are captured as a functional by-product of modern electronic communication and transaction processing infrastructure, not all elements of an otherwise informationally appropriate data are themselves informationally meaningful. That typically includes the various system identifier values, but may also encompass names of entities, time stamps, or no longer used measures – those superfluous values need to be excluded to reduce the level of noise in data. In situations in which a relatively small subset of variables might be of interest, it might be easier to take an operationally alternative route of selecting only the a priori identified data features (i.e., variables) and simply dismissing the rest.
The efficacy of the final two exploratory data analytic steps – data mining and result interpretation – is highly dependent on the robustness of the preceding data preparation steps encompassing proper cleansing, restructuring, and filtering. Mining of analyses-ready data can be undertaken using what could be referred to as analyst-guided or automated means – the former makes use of descriptive statistics selected, deployed, and evaluated based on an analyst’s judgment, whereas the latter leverages highly automated algorithms that sift through data using their internal logic. It should be noted that though the two approaches are operationally quite distinct, they nonetheless both make extensive use of the earlier discussed SSTs to identify attention-worthy relationships or outcomes, thus both are subject to the limitations of that broadly defined methodology.
It is important to not lose sight of the fact that the goal of exploratory analyses is to identify previously unknown patterns and relationships, which means that those efforts have uncertain outcomes and as such can have hard to foresee impact on organizational decision-making. New knowledge can provide some additional clarity by reinforcing the already known patterns of evidence, or can just as easily introduce evidence that contradicts or casts doubt on prior knowledge. In that sense, exploratory analyses can be likened to detective work insofar as both are focused on gathering evidence. The importance of new insights should not be over- or under-stated, and those insights should be evaluated in the context of the totality of all evidence, in the manner discussed in the Strength of Evidence section of this chapter.
Confirmatory Analyses
The central tenet of the scientific method is the formulation and testing of knowledge claims in the form of hypotheses; in the context of business analytics, those efforts frequently take the form of confirmatory analyses. Broadly characterized, confirmatory analyses make use of tools of statistical inference, significance testing, and confidence interval estimation to assess the validity of knowledge claims. In contrast to the earlier discussed exploratory analyses which can be seen as tools supporting evidence gathering detective work, confirmatory analyses can be likened to a court trial where the validity of evidence is tested.
The traditional means of conducting confirmatory analyses are rooted in dependence and interdependence families of statistical techniques. Dependence statistical methods aim to test the existence, and if so, the strength and the direction of causal statistical relationships between an outcome of interest (typically referred to as ‘dependent’ or ‘criterion’ variable) and one or more causal factors (commonly labeled as ‘independent’ or ‘predictor’ variables). Regression analyses, a broad family of statistical techniques including linear, logistic, and ordinal, to name just a few most widely used, are the best known examples of dependence confirmatory analyses. Using a dependence method, an analyst would be able to discern, for instance, which of potential influencers of consumer brand choice have statistically material impact on consumer choosing a particular brand, and would also be able to discern the direction (increasing vs. decreasing the likelihood of choosing the brand of interest) and the strength of impact of individual choice influencing factors. In the way of contrast, interdependence statistical methods aim to test the existence of more general, that is, causal or not, inter-variable relationships. The widely used correlation analysis is perhaps the best known application of interdependence statistical methods – those techniques 11 produce a more general numeric estimates of the direction and the strength of relationship that point toward some degree of co-movement or co-occurrence between pairs of variables, without addressing potential causality.
While the domain of confirmatory analyses is quite extensive and varied, the analytical process used to conduct those analyses is fairly general, as shown in Figure 7.6.
The overall confirmatory analytical process is comprised of seven distinct components, which are grouped into three explicit categories of Need Identification, Knowledge Creation, and Knowledge Dissemination. The goal of the Need Identification part of the overall process is twofold: First, it is to bring forth the agreed upon goals and priorities of the organization. To be clear, the focus of this step is simply on delineating – as opposed to deriving – the individual objectives that have been embraced by the organization; a common example is the goal of increasing customer repurchase-expressed brand loyalty. Second, it is to translate the delineated strategic objectives into specific informational goals, which in the case of brand loyalty could entail specific analyses-guiding questions, such as the assessment of repurchase incrementality of individual marketing programs. Implicitly, this step recognizes that a successful achievement of the organizational goals is, to a large degree, dependent on the attainment of a high degree of decision-making clarity. Hence, the overall objective of the Need Identification stage of the confirmatory analytical process is to distill the earlier delineated organizational goals into a clear set of informational needs.
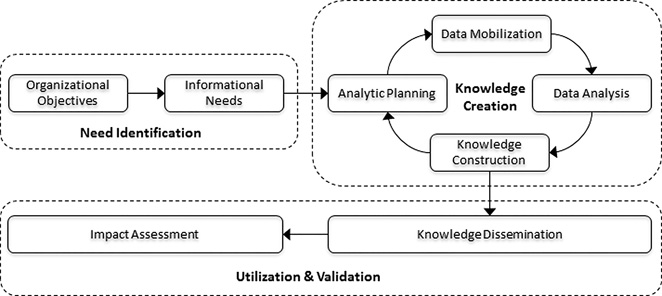
FIGURE 7.6 High-Level View of Confirmatory Analysis.
The goal of the second broad stage of the confirmatory analytical process – Knowledge Creation – is to address the specific informational needs identified earlier, which encompasses a diverse set of data analytic activities starting with gathering and review of data, analyses of data, and translation of often esoteric data analytic outcomes into easily understandable – to nontechnical users – decision-guiding insights. That is both a tall order and a very broadly scoped endeavor. As graphically shown in Figure 7.6, it encompasses four distinct process-linked components: Analytic Planning, Data Mobilization, Data Analysis, and Knowledge Construction. It is an iterative process which continues to refresh data-derived knowledge supporting current goals, or generates new knowledge for updated or newly established goals; in a sense, this is the ‘engine’ of organizational data utilization.
Lastly, the confirmatory data analytical process culminates in the Knowledge Dissemination step, a deceptively simple, logical conclusion to the overall progression. It is, however, a very important conclusive step within the 3E framework where often technical outcomes of statistical analyses are translated into more universally understandable insights. This is also where the earlier discussed limitations of statistical analyses, such as the (statistical) significance inflating effect of sample size, need to be carefully addressed to make sure that the resultant decision-guiding insights exhibit the requisite validity and reliability.
The overview of confirmatory analytic approaches would be incomplete without at least mentioning machine learning. A subset of artificial intelligence (AI), which is a domain of knowledge focusing on development of computer systems that are able to perform tasks that normally require human intelligence, machine learning is an application of AI geared toward providing computers with the ability to learn (in a more narrowly defined sense than outlined in Chapter 1), in either supervised or unsupervised 12 fashion and without being explicitly programmed. Within the confines of confirmatory analyses, it is the supervised machine learning that can be used to perform, in the far more automated fashion, data analytic tasks that traditionally required human expertise. In fact, many of the commonly used classical statistical techniques, such as linear or logistic regression, discriminant analysis, or factor analysis are now readily available in machine learning systems. That said, it should be noted that the primary benefit of leveraging machine learning is to make use of more recently developed algorithms, such as support vector machines, ensemble methods or neural networks, that take fuller advantage of computational power of machines by leveraging mathematical optimization-based techniques which offer robust alternatives to classical statistical theory-based confirmatory data analytic approaches.
When to use it
A marketing manager evaluating the difference in conversion rates between two ad campaigns: interpret statistical significance and practical importance.
An insurance analyst comparing claim costs across regions: use confidence intervals to express the magnitude of differences.
A product manager testing A/B test results: avoid misinterpreting statistical significance as practical significance.
FROM THEORY TO EVERYDAY LIFE
In practice
Auto Accident Claim Cost Comparison
An insurance claim manager compared average auto accident costs for Location A ($2,995) and Location B ($3,405). The difference of $410 was found statistically significant via a t-test. However, statistical significance applies to a range, not a point estimate. With a standard error of $45, the 95% confidence interval for the difference is $321.8 to $498.2, providing a more accurate interpretation. Using the point estimate alone misinterprets the significance test.
A MOMENT TO REFLECT
Put it to work.
When you see a statistically significant result in a business report, what additional information would you need to assess its practical significance?
Why is it important to report confidence intervals rather than just point estimates when using statistical significance tests?
How does sample size affect the interpretation of statistical significance, especially in large datasets?
Often confused with
CONTINUE THE CONVERSATION
Source texts
- Evidence-Based Decision-Making How to Leverage Available Data and Avoid Cognitive Biases (Andrew D. Banasiewicz)