Standard Deviation
Standard deviation measures how spread out values are around their mean. It helps describe variability that an average alone conceals, though it does not capture every feature of a distribution or every kind of risk.
THE IDEA
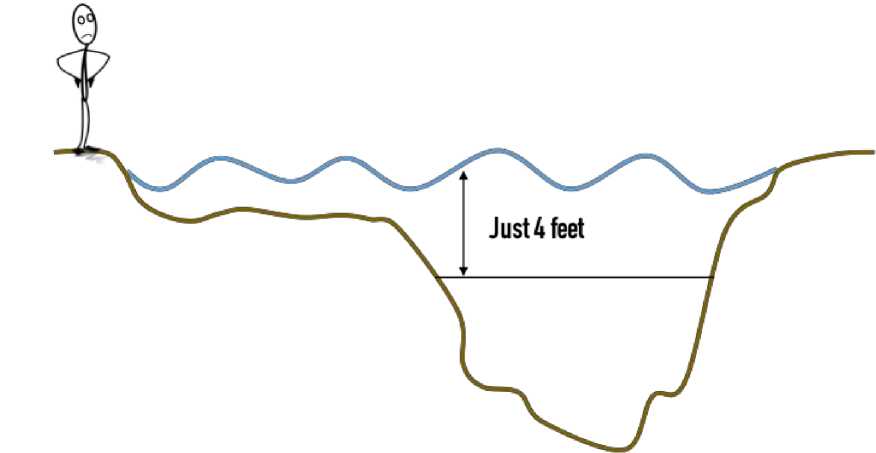
Don’t cross a river if it is (on average) four feet deep. —Nassim Taleb
Standard deviation is the square root of variance, which is based on squared deviations from the mean. It is nonnegative and uses the same units as the data.
To understand this concept, we need to analyze 2 fundamental concepts.
- Mathematical expectation, expected value or mean: It is the mean of our data series.
- Deviation: The deviation is the separation that exists between any value of the series and the mean.
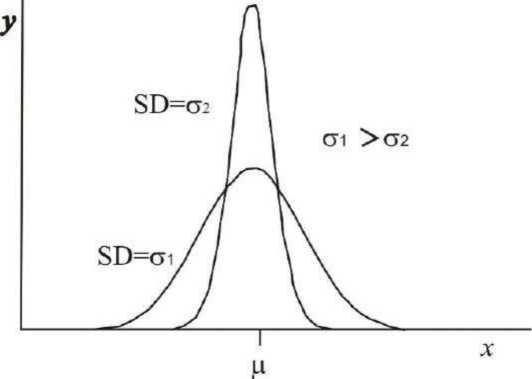
Larger standard deviation indicates greater spread around the mean.
The symbol σ (sigma) is frequently used to represent the standard deviation of a population, while s is used to represent the standard deviation of a sample. Variation that is random or natural in a process is commonly known as noise.
Standard deviation can be used to establish a baseline value for estimating the overall variation of a process.
Example: Hospital Discharge Times
The administrators monitor the discharge time of patients treated in the emergency areas of two hospitals. Although the average exit times are approximately the same (35 minutes), the standard deviations are significantly different. The standard deviation for hospital 1 is approximately 6. This describes a spread of approximately 6 minutes around the mean (dashed line), using squared deviations rather than average absolute distance. The standard deviation for hospital 2 is approximately 20. The larger spread of approximately 20 minutes indicates less consistent discharge times.
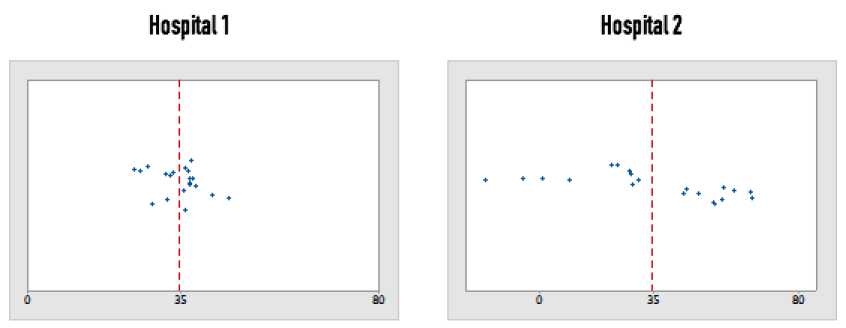
Graphically it would be:
Standard deviation describes variation among observations; standard error describes uncertainty in an estimated statistic. For an independent, identically distributed sample with finite variance, the standard error of the mean is the population standard deviation divided by the square root of sample size. A normal-approximation margin of error is about twice the standard error for a 95 percent confidence interval, with details depending on the design and estimator.
The standard deviation is also important in finance, where the standard deviation on the rate of return on an investment is a measure of the volatility of the investment.
For a sample, the usual sample variance uses degrees-of-freedom correction to estimate population variance without bias under independent sampling. Taking its square root gives the usual sample standard deviation, which is not itself generally unbiased for the population standard deviation.
It is common to read and use means to simplify the data without taking into account the standard deviation, which can lead to major errors.
The source cites an average annual US stock-market return over 200 years of 7%, alongside annual changes of -40% to +40%. It supplies no time window or return definition, so these figures should not be treated as a verified historical range or as bounds on future returns.
When to use it
Assessing the consistency of manufacturing processes to reduce defects.
Evaluating investment risk by analyzing the volatility (standard deviation) of historical returns.
Comparing customer wait times across different service locations to identify which one needs process improvement.
Understanding the spread of test scores in a classroom to tailor instruction to student needs.
FROM THEORY TO EVERYDAY LIFE
In practice
The River Crossing
Nassim Taleb's quote: "Don’t cross a river if it is (on average) four feet deep." Knowing only the average depth hides the fact that some parts may be much deeper, making the crossing dangerous. The standard deviation would reveal this variability.
Hospital Discharge Times
Two hospitals have the same average discharge time of 35 minutes, but Hospital 1 has a standard deviation of 6 minutes while Hospital 2 has a standard deviation of 20 minutes. This indicates that Hospital 2’s discharge times are far more inconsistent, which could signal process inefficiencies or staffing issues.
Stock Market Returns
The source illustrates market variability with a 7% average annual return and annual changes of -40% to +40%. Those figures lack a specified period and return definition. The point is that an average return alone does not describe short-term variation or possible losses.
A MOMENT TO REFLECT
Put it to work.
When you hear an average reported (e.g., average income, average test score), how does knowing the standard deviation change your interpretation?
Can you identify a situation in your own work or life where ignoring variability led to a mistake or surprise?
How could you use standard deviation to compare the reliability of two different processes or suppliers?
CONTINUE THE CONVERSATION
Source texts
- Wisdom Theory 100 Mental Models (2020) (Wisdom Theory)