Fishbone Diagram (Ishikawa Diagram)
The fishbone diagram is a root cause analysis tool that visually maps cause-and-effect relationships for an incident, using predefined categories like 5M+E or 8Ps to guide investigation and identify multiple root causes by asking 'why' along different bones.
THE IDEA
The Fishbone Diagram and Different Categories of Causes
While each RCA investigation, or inquiry, will be different, if you do RCA regularly enough or read enough inquiry reports, you start to see patterns
- in what happened or nearly went wrong (e.g. a project did not meet its deadline or keep to the agreed budget) and
- in the underlying reasons things didn't go to plan (e.g. a failure to appreciate a project's risks, alongside insufficient contingency plans).
Those doing Lean manufacturing noticed the same thing; quality problems in car production were sometimes the result of similar root causes (e.g. poor maintenance of factory machines or poorly designed parts). So, quality engineer Kaoru Ishikawa developed a ‘fishbone’ diagram to set out cause and effect relationships for quality defects. This has evolved into one of the most well‐known RCA tools.
The diagram takes an incident, a near miss or a risk of concern.[2] Then, it encourages us to look at the range of reasons (known as causal factors) why this has happened or why things might go off track. It is essentially a modification of a tree diagram, but it has more structure by emphasising certain key causal factors that you should check to make sure you haven't missed anything important when analysing the situation.
These causal factors also give you different ways to ask ‘why’ questions, taking you from immediate to contributing to root causes. You complete a fishbone diagram by asking why along the different ‘bones’ (in a similar manner to questions about prevention, detection and recovery) and – depending on the facts – you will likely establish several root causes for a given area of concern. An example of a fishbone diagram is provided in [Diagram 2.1]. Note that although there are six cause types listed in the diagram, there may only be two or three cause types present for a specific area of concern; it all depends on the facts.
Different versions of the fishbone diagram can be found. Popular root cause categories you might see include the following:
- In a manufacturing context: Manpower, Machines, Materials, Methods, Measurements and Environment (known as 5M+E);
- In a sales and marketing context: Price, Place, Promotion, People, Process, Performance, etc. (known as 8Ps).
And more generally: 3. Strategy, Skills, Staff, Structure, Systems, etc., after the McKinsey 7S framework;[3]
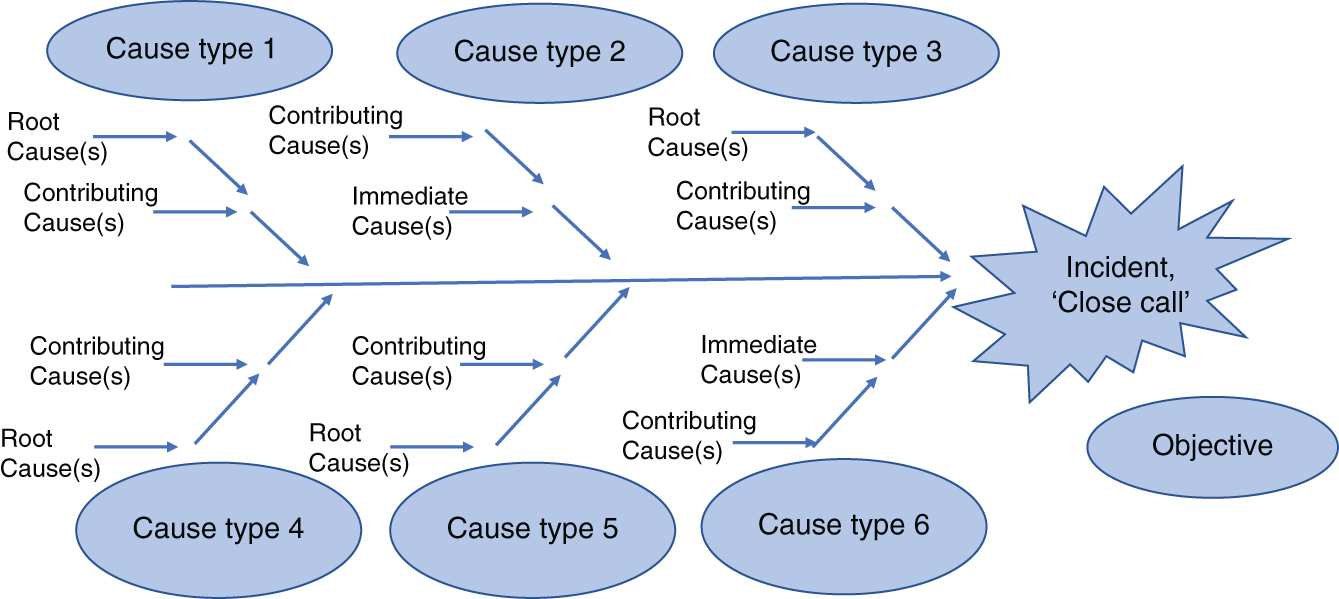
[Diagram 2.1] Fishbone diagram 4. Strategy, Structure, Processes, People, etc., after the Galbraith Star Model;[4] 5. Strategy and Objective Setting, Information and Communication, Governance and Culture, etc., after the COSO Model.[5]
Over the years of working with clients, I have noticed categories that seem to help people understand why things haven't been working, but also how easy it is to misunderstand some categories and, as a result, get confused about the root causes. Here are two examples to illustrate the point:
- If you have ‘People’ or ‘Staff’ as an area to focus on, it is easy to focus on who was involved and who, perhaps, didn't get it right rather than why these people did what they did.
- Likewise, if you have ‘Materials’, ‘Methods’, ‘Processes’ or ‘Systems’ as lines for inquiry, you might focus on what and how rather than why.
Dr Mohammad Farhad Peerally (Associate Professor, University of Leicester) offers his perspective:
‘I have studied the use of RCA in a medical context for several years. Over time, RCA practice has evolved and become more powerful. But there is no doubt that when you look at early attempts to analyze causes, the categories of “people” and “process” can be heavily populated. After all, many things come back to these factors, but this doesn't explain why.’
When to use it
Investigating quality defects in a manufacturing production line.
Analyzing why a software development project missed its deadline or exceeded its budget.
Understanding the causes of patient safety incidents in a healthcare setting.
Exploring reasons for a decline in sales or customer satisfaction in a business context.
FROM THEORY TO EVERYDAY LIFE
In practice
Project Delay Analysis
A construction project missed its deadline. A team uses a fishbone diagram with categories like Manpower, Methods, Machines, Materials, Measurements, and Environment. They identify that insufficient training (Manpower) and poor scheduling (Methods) were root causes, leading to corrective actions.
Medical Error Investigation
After a medication error, a hospital uses a fishbone diagram with healthcare-specific categories (e.g., People, Process, Technology, Environment). They discover that unclear labeling (Process) and interruptions during administration (Environment) contributed, prompting system redesign.
A MOMENT TO REFLECT
Put it to work.
Think of a recent problem you encountered. How would you use a fishbone diagram to systematically explore its potential root causes across different categories?
When using categories like 'People' or 'Process', how can you ensure you are focusing on why something happened rather than who was involved?
What modifications would you make to the standard fishbone categories for a specific domain you work in?
Often confused with
References
- McKinsey 7S Framework
- Galbraith Star Model
- COSO Model
CONTINUE THE CONVERSATION
Source texts
- Beyond the Five Whys Root Cause Analysis and Systems Thinking (James C. Paterson)