The Matrix Method for Structuring Data
A heuristic that uses a matrix to organize and analyze data, making it easier to spot correlations and solve logic puzzles.
THE IDEA
EXERCISE 14 Symptom and Disease
On a sheet of paper create a matrix out of the following information (excerpted from The Universe Within):
37 patients with a particular symptom had a disease.
33 patients with the same symptom did not have the disease.
17 patients without the symptom had the disease.
13 patients without the symptom did not have the disease.
This is good practice in constructing a matrix. Don’t be upset if you have difficulty doing it. The more you use matrices, the easier it will become.
 BEFORE CONTINUING, FINISH CONSTRUCTING YOUR MATRIX.
The matrix should appear as shown in Part 1 of the solution to Exercise 14 (page 326).
Creating a matrix is a piece of cake once you get the hang of it. See how putting the numerical data into matrix form has the effect of isolating the data so they can be analyzed more easily, both separately and in combination. See how much easier it is to focus on the data when they are in a matrix than when they are presented in sentences?
The question to which these data are to be applied is the following:
Is there a correlation between the symptom and the disease? Here that means: Is disease more common among people with the symptom than among those without it?
Based on the data in the matrix, what do you think? Think about it for a moment, then write your answer on a sheet of paper.
BEFORE CONTINUING, WRITE DOWN YOUR ANSWER.
When a group of nurses was given this problem, 85 percent of them concluded there was a correlation, pointing out that there were more cases with both symptom and disease (37) than in any of the other three categories or that twice as many people had the symptom (37) as didn’t (17). But those comparisons do not establish a positive association. For even among people without the disease, about the same majority had the symptom (33 had it, 13 didn’t). This becomes clearer when viewed as percentages from the standpoint of symptoms (Part 2 of the solution to Exercise 14). The percentage of those with symptom and with disease is roughly the same as those without symptom and with disease. If the proportions were exactly the same, the table would show no association. Here they are close, so the counts do not support the strong positive relationship suggested by looking at the largest cell alone.
Looked at from the standpoint of disease (Part 3 of the solution to Exercise 14), the percentage of those with disease and with symptom was roughly comparable to those without disease and with symptom. Again, the proportions are close. That is different from proving that there is exactly no association in the wider patient population.
Putting the numbers into a matrix allows us to structure the analysis of the data easily and meaningfully. Learn to use a matrix. It’s a marvelous analytic tool.
Let’s do another matrix exercise.
The Hats and Coats Problem
This one is a simple brainteaser and demonstrates graphically how a matrix can help us solve a problem. Here are the clues:
Smith, Brown, Jones, and Williams had dinner together. When they parted, each of them, by mistake, wore the hat belonging to one other member of the party and the coat belonging to yet another member. The man who took Williams’s hat took Jones’s coat. Smith took Brown’s hat. The hat taken by Jones belonged to the owner of the coat taken by Williams.
Who took Smith’s coat?
Let’s work the problem together. We begin by constructing a matrix (Figure 8-6). Our objective is to identify the four members represented by the numbers 1, 2, 3, and 4. Let’s go through the clues and fill out the matrix as we go.
The man who took Williams’s hat took Jones’s coat. So we enter “Williams” in “Hat 1” and “Jones” in “Coat 1” (Figure 8-7). We don’t know yet who Member No. 1 is, but we do know it is neither Williams nor Jones, because neither could take his own hat or coat. So we place their names at the tops of columns 2 and 3 (Figure 8-8).
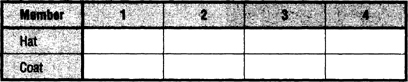
FIGURE 8-6
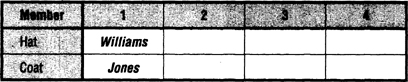
FIGURE 8-7
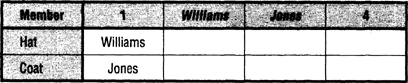
FIGURE 8-8
Smith took Brown’s hat. So, Smith, too, cannot be at the top of column 1. Ergo (Figure 8-9), Smith is atop column 4, and Brown is atop column 1. And, of course, Brown goes into “Hat” under “Smith.” Since Jones cannot take his own hat, the only hat left for him is Smith’s, so (Figure 8-10) Smith goes into “Hat” under “Jones.” Ergo, Jones goes into “Hat” under “Williams.”
The hat taken by Jones belonged to the owner of the coat taken by Williams. The matrix shows that the hat taken by Jones was Smith’s. So we have the answer (Figure 8-11): the coat taken by Williams was Smith’s.
Wasn’t that easy? Could you have done that in your head? I certainly couldn’t, and doing it with a matrix is quick and simple.
Just for the fun of it, let’s fill in the other two squares. The only coats left for Smith to have taken are Brown’s and Williams’s, but Smith took Brown’s hat, so he had to take another member’s coat. That means Smith took Williams’s coat. Which leaves Brown’s coat for Jones (Figure 8-12).
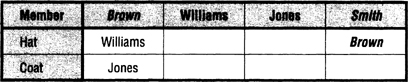
FIGURE 8-9
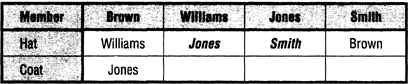
FIGURE 8-10
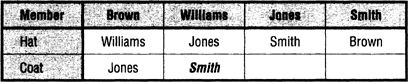
FIGURE 8-11
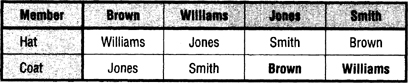
FIGURE 8-12
Try using a matrix on another problem where several attributes or constraints need to be tracked together.
When to use it
Medical diagnosis: comparing symptoms and diseases to assess correlation.
Logic puzzles: systematically tracking attributes to find unique assignments.
Business analysis: organizing survey data to compare groups.
Research: structuring experimental data to identify patterns.
FROM THEORY TO EVERYDAY LIFE
In practice
Symptom and Disease
37 patients with symptom had disease, 33 with symptom did not, 17 without symptom had disease, 13 without symptom did not. When placed in a matrix, it becomes clear that the proportion of disease among those with symptom (37/70 ≈ 53%) is similar to those without symptom (17/30 ≈ 57%), showing little difference in this table rather than establishing exactly zero correlation.
Hats and Coats Logic Puzzle
Four men (Smith, Brown, Jones, Williams) exchange hats and coats. Using a matrix to track who took whose hat and coat systematically leads to the solution: Williams took Smith's coat.
A MOMENT TO REFLECT
Put it to work.
How does placing data in a matrix help avoid misinterpretation of correlations?
Can you think of a real-world situation where a matrix could clarify a complex relationship?
What other types of problems might benefit from a matrix approach?
Often confused with
CONTINUE THE CONVERSATION
Source texts
- The Thinkers Toolkit by Morgan D Jones