Re-test 100 Studies
The replication crisis in scientific research is driven by p-hacking, publication bias, and low statistical power, leading to many false positive results that fail to replicate. This section explains the causes and offers ways to critically evaluate scientific claims.
THE IDEA
Re-test 100 Studies
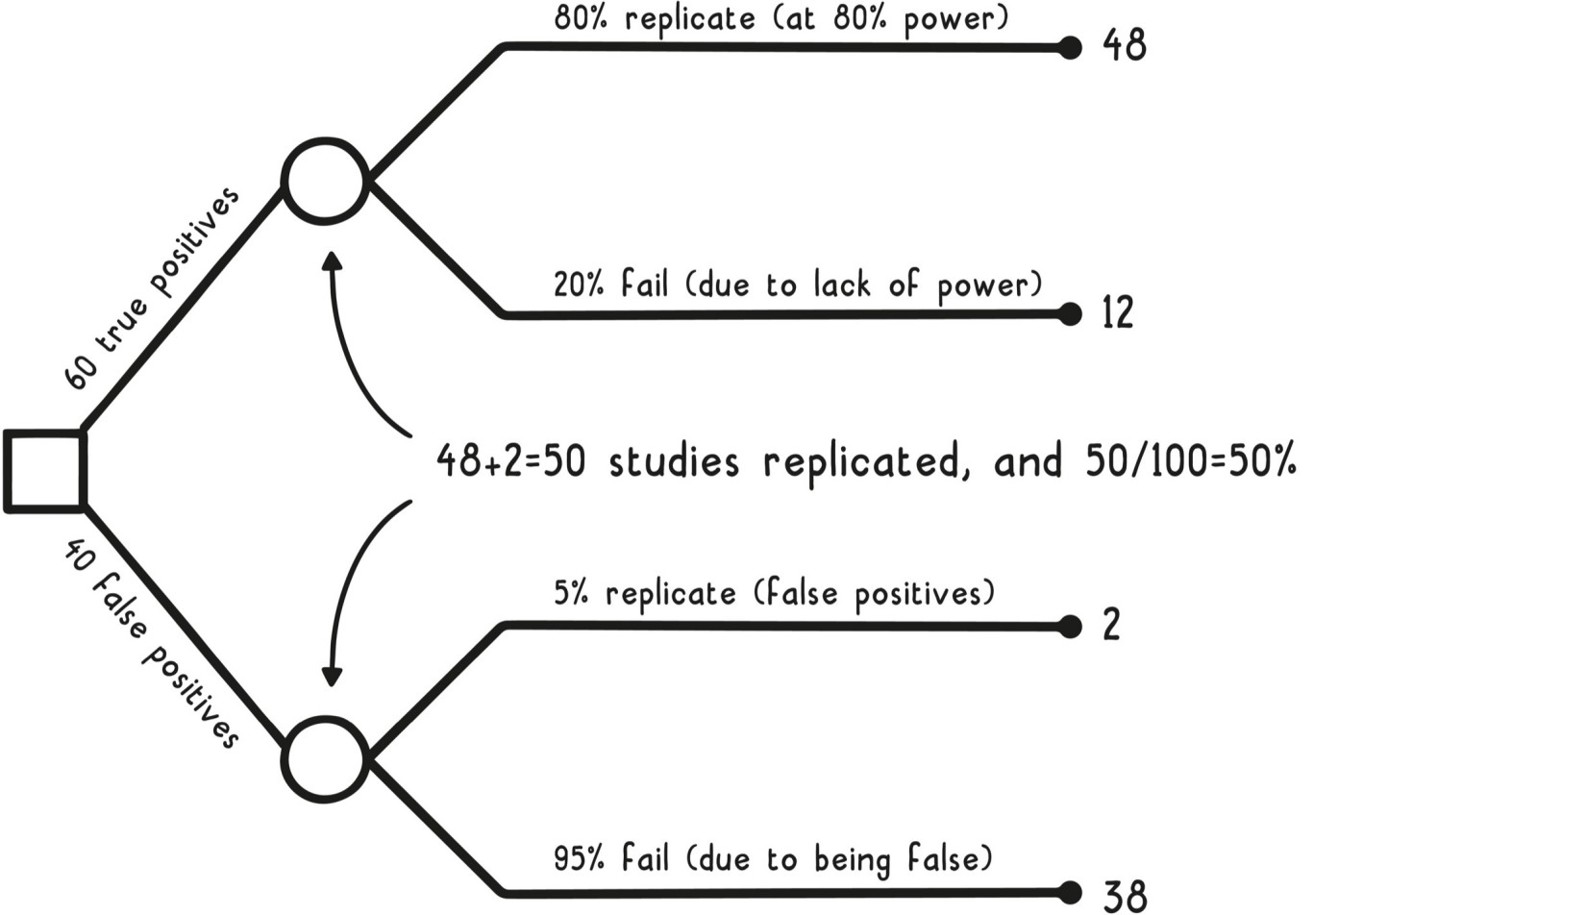
So, under this scenario, about a fourth of the failed replications (12 of 50) are explained by a lack of power in the replication efforts. These are real results that would likely be replicated successfully either if an additional replication study were done or if the original replication study had a higher sample size.
The rest of the results that failed to replicate should have never been positive results in the first place. Many of these original studies probably underestimated their type I error rate, increasing their chances of being a false positive. That’s because when a study is designed for a 5 percent chance of a false positive, that chance applies only to one statistical test, but very rarely is only one statistical test conducted.
The act of running additional tests to look for statistically significant results has many names, including data dredging, fishing, and p-hacking (trying to hack your data looking for small enough p- values). Often this is done with the best of intentions, as seeing data from an experiment can be illuminating, spurring a researcher to form new hypotheses. The temptation to test these additional hypotheses is strong, since the data needed to analyze them has already been collected. The trouble comes in, though, when a researcher overstates results that arise from these additional tests.
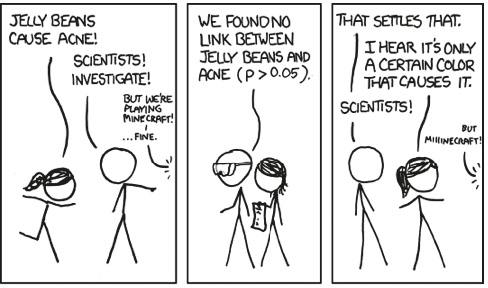
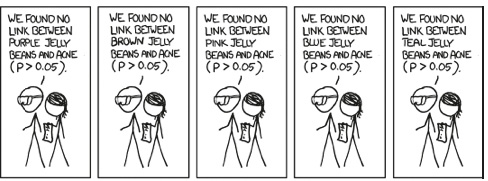
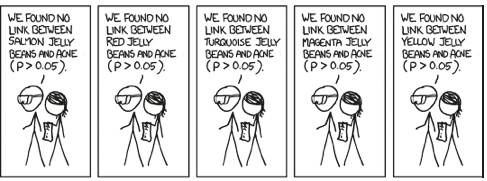
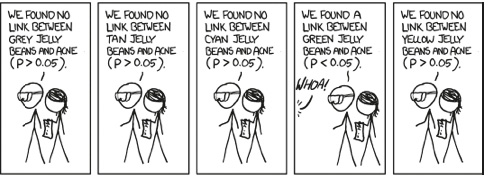
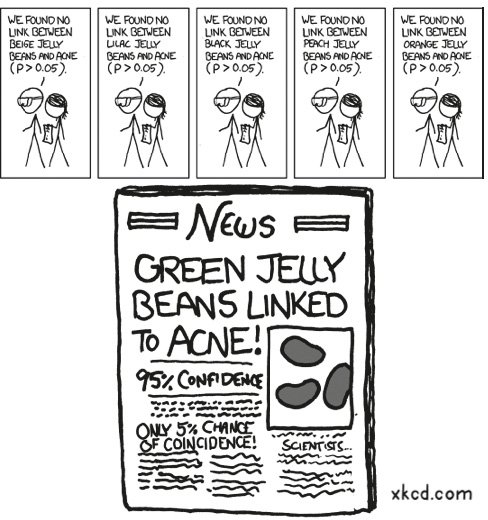
The XKCD cartoon on this page illustrates how data dredging can play out: when no statistically significant relationship was found between jelly beans and acne, the scientists proceeded to dredge through twenty-one subgroups until one with a sufficiently low p-value was found, resulting in the headline “Green Jelly Beans Linked to Acne!”
Each time another statistical test was done, the chance of forming an erroneous conclusion continued to grow above 5 percent. To see this, suppose you had a twenty-sided die. The chances of making a mistake on the first test would be the same as the chances of rolling a one. Each additional test run would be another roll of the die, each with another one-in-twenty chance of rolling a one. After twenty-one rolls (matching the twenty-one jelly bean colors in the comic), there is about a two-thirds chance that a one is rolled at least once, i.e., that there was at least one erroneous result.
If this type of data dredging happens routinely enough, then you can see why a large number of studies in the set to be replicated might have been originally false positives. In other words, in this set of one hundred studies, the base rate of false positives is likely much larger than 5 percent, and so another large part of the replication crisis can likely be explained as a base rate fallacy.
Unfortunately, studies are much, much more likely to be published if they show statistically significant results, which causes publication bias. Studies that fail to find statistically significant results are still scientifically meaningful, but both researchers and publications have a bias against them for a variety of reasons. For example, there are only so many pages in a publication, and given the choice, publications would rather publish studies with significant findings over ones with none. That’s because successful studies are more likely to attract attention from media and other researchers. Additionally, studies showing significant results are more likely to contribute to the careers of the researchers, where publication is often a requirement to advance.
Therefore, there is a strong incentive to find significant results from experiments. In the cartoon, even though the original hypothesis didn’t show a significant result, the experiment was “salvaged” and eventually published because a secondary hypothesis was found that did show a significant result. The publication of false positives like this directly contributes to the replication crisis and can delay scientific progress by influencing future research toward these false hypotheses. And the fact that negative results aren’t always reported can also lead to different people testing the same negative hypotheses over and over again because no one knows other people have tried them.
There are also many other reasons a study might not be replicable, including the various biases we’ve discussed in previous sections (e.g., selection bias, survivorship bias, etc.), which could have crept into the results. Another reason is that, by chance, the original study might have showcased a seemingly impressive effect, when in reality the effect is much more modest (regression to the mean). If this is the case, then the replication study probably does not have a large enough sample size (isn’t sufficiently powered) to detect the small effect, resulting in a failed replication of the study.
There are ways to overcome these issues, such as the following:
-
Using lower p-values to properly account for false positive error in the original study, across all the tests that are conducted
-
Using a larger sample size in a replication study to be able to detect a smaller effect size
-
Specifying statistical tests to run ahead of time to avoid p-hacking
Nevertheless, as a result of the replication crisis and the reasons that underlie it, you should be skeptical of any isolated study, especially when you don’t know how the data was gathered and analyzed. More broadly, when you interpret a claim, it is important to evaluate critically any data that backs up that claim: Is it from an isolated study or is there a body of research behind the claim? If so, how were the studies designed? Have all biases been accounted for in the designs and analyses? And so on.
Many times, this investigation will require some digging. Media sources can draw false conclusions and rarely provide the necessary details to allow you to understand the full design of an experiment and evaluate its quality, so you will usually need to consult the original scientific publication. Nearly all journals require a full section describing the statistical design of a study, but given the word constraints of a typical journal article, details are sometimes left out. Look for longer versions or related presentations on research websites. Researchers are also generally willing to answer questions about their research.
In the ideal scenario, you would be able to find a body of research made up of many studies, which would eliminate doubts as to whether a certain result was a chance occurrence. If you are lucky, someone has already published a systematic review about your research question. Systematic reviews are an organized way to evaluate a research question using the whole body of research on a certain topic. They define a detailed and comprehensive (systematic) plan for reviewing study results in an area, including identifying and finding relevant studies in order to remove bias from the process.
Some but not all systematic reviews include meta-analyses, which use statistical techniques to combine data from several studies into one analysis. The data-driven reporting site FiveThirtyEight is a good example; it conducts meta-analyses across polling data to better predict political outcomes.
There are advantages to meta-analyses, as combining data from multiple studies can increase the precision and accuracy of estimates, but they also have their drawbacks. For example, it is problematic to combine data across studies where the designs or sample populations vary too much. They also cannot eliminate biases from the original studies themselves. Further, both systematic reviews and meta-analyses can be compromised by publication bias because they can include only results that are publicly available.
Whenever we are looking at the validity of a claim, we first look to see whether a thorough systematic review has been conducted, and if so, we start there. After all, systematic reviews and meta-analyses are commonly used by policy makers in decision making, e.g., in developing medical guidelines.
If one thing is clear from this chapter, it’s probably that designing good experiments is tough! We hope you’ve also gathered that probability and statistics are useful tools for better understanding problems that involve uncertainty. However, as this section should also make clear, statistics is not a magical cure for uncertainty. As statistician Andrew Gelman suggested in The American Statistician in 2016, we must “move toward a greater acceptance of uncertainty and embracing of variation.”
More generally, keep in mind that while statistics can help you obtain confident predictions across a variety of circumstances, it cannot accurately predict what will occur in an individual event. For instance, you may know that the average summer day is sunny and warm at your favorite beach spot, but that is no guarantee that it won’t be rainy or unseasonably cool the week you plan to take off from work.
Similarly, medical research tells you that your risk of getting lung cancer increases if you smoke, and while you can estimate the confidence interval that an average smoker will get lung cancer in their lifetime, probability and statistics can’t tell you what specifically will happen for any one individual smoker.
While probability and statistics aren’t magic, they do help you better describe your confidence around the likelihood of various outcomes. There are certainly lots of pitfalls to watch out for, but we hope you also take away the fact that research and data are more useful for navigating uncertainty than hunches and opinions.
KEY TAKEAWAYS
-
Avoid succumbing to the gambler’s fallacy or the base rate fallacy.
-
Anecdotal evidence and correlations you see in data are good hypothesis generators, but correlation does not imply causation—you still need to rely on well-designed experiments to draw strong conclusions.
-
Look for tried-and-true experimental designs, such as randomized controlled experiments or A/B testing, that show statistical significance.
-
The normal distribution is particularly useful in experimental analysis due to the central limit theorem. Recall that in a normal distribution, about 68 percent of values fall within one standard deviation, and 95 percent within two.
-
Any isolated experiment can result in a false positive or a false negative and can also be biased by myriad factors, most commonly selection bias, response bias, and survivorship bias.
-
Replication increases confidence in results, so start by looking for a systematic review and/or meta-analysis when researching an area.
-
Always keep in mind that when dealing with uncertainty, the values you see reported or calculate yourself are uncertain themselves, and that you should seek out and report values with error bars!
When to use it
When reading a news article about a new medical study, check if the result has been replicated or if it's based on a single study with possible p-hacking.
When designing an experiment, pre-register your hypotheses and analysis plan to avoid data dredging.
When making a decision based on statistical evidence (e.g., policy making), prioritize systematic reviews over individual studies.
When evaluating a claim, remember that even well-designed studies can produce false positives, so look for consistency across multiple studies.
FROM THEORY TO EVERYDAY LIFE
In practice
Green Jelly Beans Linked to Acne
In an XKCD comic, scientists found no correlation between jelly beans and acne overall, but by testing 21 colors individually, they found a statistically significant p-value for green jelly beans, leading to a false headline. Multiple testing without correction enables p-hacking.
Twenty-Sided Die Analogy
Each additional statistical test is like rolling a twenty-sided die: with a 5% chance of rolling a one (false positive). After 21 tests, there's about a two-thirds chance of at least one false positive, showing how multiple testing inflates error rates.
A MOMENT TO REFLECT
Put it to work.
How might p-hacking affect your own interpretation of scientific studies you read in the news?
What steps can you take to critically evaluate a single study rather than relying on its headline?
Why is it important to look for systematic reviews or meta-analyses when researching a topic?
Often confused with
References
- Moving toward a greater acceptance of uncertainty and embracing of variation — Andrew Gelman (2016)
CONTINUE THE CONVERSATION
Source texts
- Super Thinking (Gabriel Weinberg, Lauren McCann)