Random Support Theory (RST)
Random Support Theory (RST) is a parametric model of calibration that combines elements of support theory and signal detection theory, using parameters α (discrimination ability), σ (extremity), and β (response bias) to describe how probability judgments reflect the balance of evidence for correct and incorrect hypotheses.
THE IDEA
Random Support Theory
The predictions of the heuristics and biases perspective are typically qualitative in nature, but Brenner (1995) introduced a parametric model of calibration that makes precise quantitative predictions. Random support theory (RST; Brenner, 1995) combines elements of support theory (Rottenstreich & Tversky, 1997; Tversky & Koehler, 1994) and signal detection theory (e.g., Tanner & Swets, 1954) to fit calibration data and yield a set of psychologically meaningful parameters. Support theory itself is a “coherence theory” of subjective probability and evidence strength, describing when and why intuitive probability judgments depart from the syntactic rules of probability theory. RST extends the logic of support theory to the semantic question of the “correspondence” of the probability and the actual outcome (cf. Hammond, 1996). According to RST, probability judgments reflect the balance of evidence captured by underlying distributions of support for correct and incorrect hypotheses. Based on the observed probability judgments and the associated outcomes, RST provides an efficient summary of these underlying support distributions. We focus on three parameters of the model: Alpha (α) measures the judge’s discrimination ability, defined as the difference in support for correct and incorrect hypotheses, indexing the quality or “weight” of the evidence. Sigma (σ) measures the extremity of the judge’s responses, defined as the tendency to depart from the base-rate value, indexing the perceived strength of the evidence. Beta (β) measures the differential support received by the focal hypothesis; among other things, β can be viewed as an index of a judge’s sensitivity to the outcome base rate.
In this model, good calibration arises when σ is matched to α so that extremity of judgment is appropriate for the level of evidence quality, and when the outcome base rate is matched by the use of β. A zero response bias (β = 0) is appropriate when the base rate is 50%; an increasingly negative response bias maintains calibration as the base rate moves below 50%, and an increasingly positive response bias maintains calibration as the base rate moves above 50%. The patterns of miscalibration presented in Fig. 39.1 were generated by RST: overprediction was simulated by a low base rate (20% probability of focal outcome) with no bias adjustment (β = 0), and a balance between extremity and discriminability (σ = α); underprediction was simulated by a high base rate (80% probability of focal outcome) with no bias adjustment (β = 0), and a balance between extremity and discriminability (σ = α); overextremity was simulated by a moderate base rate (50%), and greater extremity than discriminability (σ > α); and underextremity was simulated by a moderate base rate (50%), and less extremity than discriminability (σ < α).
Support theory and RST are closely related to the strength–weight model of confidence and calibration (Griffin & Tversky, 1992), sharing an assumption that confidence or judged probability reflects the support or strength of evidence for the focal hypothesis relative to that for its alternative. These models all belong to a class we refer to as direct support models because of their common assumption that confidence (when measured via judged probability) reflects a direct translation of the support, or strength of evidence, of the focal outcome relative to that of its alternative. Direct support models naturally depict judgments of confidence as case-based, in the sense that support is based on an assessment of the available evidence regarding the case at hand. In case-based judgment, the impression conveyed by the evidence determines the degree of confidence, with little regard given to the reliability of the relationship between the evidence and the target event. Such an interpretation is consistent with the observation that people are often insensitive to characteristics of the larger set of events to which the specific case at hand belongs, such as base rates or evidence quality (e.g., Kahneman & Tversky, 1973). In certain instances, set-based characteristics may be treated by people as arguments in a case-based evaluation; for example, the base rate of a medical condition may be one argument considered by a physician (“There is a lot of that going around”). However, such usage typically leads to underweighting of the base rate compared to the ideal statistical model. The impact of a base-rate “argument” seems to be determined by its apparent relevance to the case at hand (Tversky & Kahneman, 1982) rather than by considerations of the reliability of the evidence, as in the Bayesian model. When base rates are used, as in a within-subjects design, they are used in an additive manner, rather than in the multiplicative manner required by the Bayesian model (Novemsky and Kronzon, 1999). This is consistent with the notion that when base rates are salient, they are used to adjust the case-based impression, which acts as an anchor (Griffin & Tversky, 1992).
An advantage of direct support models is that, in many cases, people can provide direct ratings of the extent to which the available evidence supports a given hypothesis. Consider as an example a study reported by Tversky and Koehler (1994, Study 3; for details, see Koehler, 1996), in which subjects assessed the probability that the home team would win in each of 20 upcoming basketball games among a set of five Pacific Division NBA teams. Subjects were asked to rate the strength of each of the five teams, which was assumed to be monotonically related to the team’s support in the confidence assessment via a power transformation. As shown in Fig. 39.2 (circles), the predictions based on the team strength ratings fit the mean probability judgment data quite closely. Koehler, Brenner, and Tversky (1997) report the results of a number of additional studies in which direct ratings of support are used successfully to fit probability judgments.
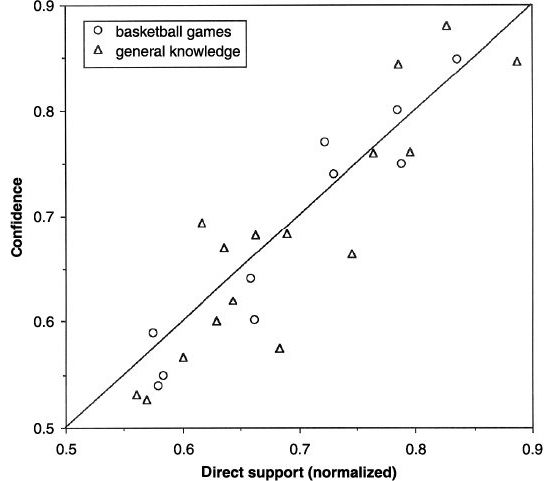
Figure 39.2. Confidence as predicted by normalized direct ratings of support, for basketball game predictions (Koehler, 1996; Tversky & Koehler, 1994) and general-knowledge questions (Varey, Griffin, & James, 1998).
Note: Basketball data compares mean judged probability assigned to predicted winning team (inferred from full-range probability assigned to home team) with normalized direct ratings of “team strength” obtained from the same group of subjects. General-knowledge data compares mean confidence in selected answer with direct ratings of “proportion of evidence” supporting chosen alternative obtained from a separate group of subjects.
The triangles in Fig. 39.2 plot mean judgments of evidence strength against mean probability judgments for general knowledge questions (Varey, Griffin, & James, 1998). Subjects in a “support” condition were asked to report the proportion of evidence available to them supporting each alternative whereas subjects in a “confidence” condition reported their subjective probability that each alternative was correct. For both sports predictions and general knowledge answers, the slope of the best-fitting regression line is very close to 1.0, consistent with the notion that respondents directly translated their impressions of support into probability judgments (cf. Kahneman & Tversky, 1973).
When to use it
Financial forecasting: Evaluating the calibration of an analyst's probability estimates for market movements and identifying whether miscalibration is due to poor discrimination, overextremity, or base-rate neglect.
Medical diagnosis: Assessing a physician's confidence in diagnoses by examining how their probability judgments correlate with actual outcomes, using RST parameters to pinpoint biases.
Sports judgments: Using team-strength ratings to model the probabilities people assign to game outcomes, as in the basketball study.
General knowledge testing: Analyzing confidence-accuracy relationships in educational settings to understand whether students are well-calibrated or overconfident.
FROM THEORY TO EVERYDAY LIFE
In practice
Basketball Game Predictions
In a study by Tversky and Koehler (1994, Study 3), subjects assessed the probability that the home team would win in each of 20 upcoming NBA games among five Pacific Division teams. They also rated the strength of each team. The predicted probabilities based on normalized team strength ratings closely matched the mean judged probabilities, supporting the direct support model.
General Knowledge Confidence Ratings
Varey, Griffin, and James (1998) asked subjects either to report the proportion of evidence supporting each alternative (support condition) or to give their subjective probability that each alternative was correct (confidence condition) for general knowledge questions. The slope of the regression line between evidence strength and probability judgments was near 1.0, consistent with direct translation of support into confidence.
A MOMENT TO REFLECT
Put it to work.
Consider a set of predictions for which you recorded both probabilities and outcomes. What would discrimination (α), extremity (σ), and base-rate adjustment (β) help you distinguish about their calibration?
Consider a scenario where you consistently overestimate the likelihood of positive outcomes. Using RST, what combination of parameters (α, σ, β) could lead to overprediction? How might you adjust your judgment process?
In a medical diagnosis context, a doctor often says 'There is a lot of that going around' to justify a higher probability. How does this align with the case-based and base-rate usage described in the text, and what are the potential pitfalls?
Often confused with
References
- — Brenner (1995)
CONTINUE THE CONVERSATION
Source texts
- Heuristics and Biases The Psychology of Intuitive Judgment (Thomas Gilovich, Dale Griffin, Daniel Kahneman)