Utility Versus Probability
Utility analysis separates how much an outcome matters to you from how likely it is under each option. A utility matrix lists options and outcomes, assigns utilities and probabilities, and combines them into expected utilities. The result depends on those judgments and estimates.
THE IDEA
Utility Versus Probability
Utility analysis structures a decision by separating two questions: how much each outcome is worth to the decision maker, and how likely that outcome is under each option. Keeping these judgments distinct makes their assumptions easier to inspect.
Consider the fundamental disparity between the utility and probability questions:
Utility: If this option is selected and this outcome occurs, what is the utility?
Probability: If this option is selected, what is the probability this outcome will occur?
The utility question concerns value; the probability question concerns likelihood. A desirable outcome need not be likely, and a likely outcome need not be desirable. Confusing these judgments can make a discussion sound more conclusive than the evidence warrants.
Listen to a conversation about a difficult choice. Someone may describe a result they want and then speak as though wanting it makes it likely. Someone else may reject a likely result because it would be unwelcome. Keeping value and likelihood separate helps reveal those shifts. Estimate each explicitly before combining them.
The distinction is familiar. A child may want an expensive toy while expecting their parents to refuse. A teenager may want someone’s affection but have little evidence about whether it is returned. As adults, we face the same separation between what an outcome would mean to us and what we can reasonably expect. Utility analysis makes that separation explicit.
Forecasting another person’s decision adds a further complication: their preferences can influence what they do to make an outcome possible. A person, business, or government may invest effort and resources in a goal it values. That can change the available options and their probabilities. But a strong preference is not evidence that obstacles will be overcome; examine the capabilities and actions as well.
The author illustrates this with German planning in 1943 for an anticipated Allied invasion. German strategists treated the lack of a major port at Normandy as “evidence” against it being the main landing site. They expected the Allies to need substantial port facilities for supplies and reinforcements, and many favored Calais as the likely target. The account also reports that Hitler disregarded a warning about the eventual landing. The relevant issue is the assumption about what the Allies could do, rather than the warning’s reported precision.
What Hitler and his military advisers failed to recognize was that the Allies were so intent on (saw such great utility in) invading at Normandy that they would devise some way of overcoming its inhospitable shore, thereby increasing the probability of the invasion’s success. What they did—a spectacular feat of engineering—was to build two complete prefabricated artificial harbors, each comprising a breakwater of sunken ships, an outer seawall of huge concrete boxlike structures (some the size of three-story buildings), and floating roadways and piers. Some twenty thousand workers in harbors all over Britain constructed the components in only seven months, and an armada of two hundred tugboats towed them to Normandy. The Nazis obtained photoreconnaissance of the structures under construction but did not discern their real purpose. The artificial harbors helped address a logistical problem. They were part of a much larger invasion effort, so the example does not establish that this engineering solution alone caused the landing’s success or Germany’s defeat.
Utility analysis can initially look like “number crunching,” but its most demanding work comes before the arithmetic: defining outcomes, judging their value, and estimating probabilities. I became more comfortable with the method through practice. Confidence in its structure should still be distinguished from confidence in the inputs.
15 The Utility Matrix
A matrix offers two important advantages over a tree for performing utility analysis. First, the relative differences in utility values of outcomes are more easily perceived in a matrix than in a tree. Second, arithmetic calculations are easier to perform. This is due, in part, to the different configurations of the two structuring devices: a tree is busy, sort of sprawls out, and is sometimes unsymmetrical, while a matrix is a compact, tightly organized, symmetrical unit. Also, the focus of a utility matrix is squarely on alternative outcomes, while a tree portrays whole scenarios in which outcomes are only a part. Depicting scenarios—the strong suit of trees—tends to overshadow and divert attention from the outcomes.
Which is a better vehicle for utility analysis: a matrix or a tree? Naturally, the answer depends on the nature of the problem being analyzed and on the personal preference of the analyst. The analytic steps are the same in either case: construct a matrix or a tree, enter the options and outcomes, define the analytic perspective, assign utility values, assign probabilities, compute expected values, and determine the rankings.
A matrix can also make it easier to compare different perspectives or classes of outcome. Keep track of whose preferences the utilities represent and avoid combining values that are measured on incompatible scales.
Figure 15-1 in the source shows the basic elements of a utility matrix. The worked exercises below depend on their accompanying diagrams; the description here explains the method independently.
The analytic perspective goes in the upper left-hand corner, options down the left, and outcomes across the columns. Each cell contains the utility and probability for an option-outcome combination. Multiplying them gives its contribution to expected utility. Add those contributions for an option in the “Total EV” column, then rank the totals. The outcomes must cover the relevant possibilities without double-counting, and the probabilities for each option must form a consistent distribution.
You can see this more clearly as I convert into a matrix the three utility trees (Figure 15-2) we constructed for the “Japanese Goods” problem in Chapter 14. The resulting matrix is shown in Figure 15-3.
Observe how the matrix does, indeed, focus your attention on the outcomes, placing all the numerical data for each option-outcome combination neatly into a single cell. I find it easier to discern patterns, differences, and similarities with a matrix than with trees, but it’s really a matter of personal preference.
To get a feel for what makes up a utility matrix, try your hand at converting the trees (Figure 15-4) we constructed for the “Egg-Laying Hens” exercise in Chapter 14.
 BEFORE CONTINUING, CONVERT THE TREES INTO A UTILITY MATRIX.
Figure 15-5 is the utility matrix for the “Egg-Laying Hens” problem.
Now convert to a matrix the utility trees for the “Jelly Beans” problem (Figure 15-6).
BEFORE CONTINUING, CONVERT THE TREES INTO A UTILITY MATRIX.
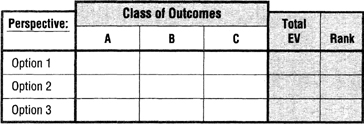
FIGURE 15-1 Utility Matrix
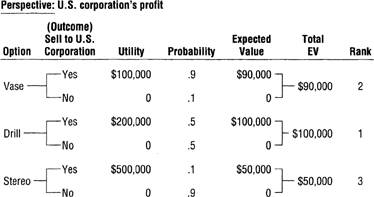
FIGURE 15-2
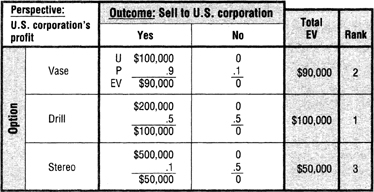
FIGURE 15-3
Figure 15-7 is the utility matrix for the “Jelly Beans” problem.
Convert the trees for the “Securities Investment” problem (Figure 15-8).
BEFORE CONTINUING, CONVERT THE TREES INTO A UTILITY MATRIX.
Figure 15-9 is the utility matrix for the “Securities Investment” problem. “National political and economic situation” is the class of outcome.
When to use it
Investment decisions: evaluating stocks by separating the utility of returns from the probability of market outcomes.
Comparing job paths by considering what their possible outcomes are worth to you and estimating the likelihood of each outcome separately.
Assessing a new market by separately estimating possible outcomes, their value to the business, and the evidence for their likelihood.
Distinguishing a hope about a relationship from evidence about whether the other person shares it.
FROM THEORY TO EVERYDAY LIFE
In practice
Child's Toy Example
A young child wants a new toy but knows their parents won't buy it because it's too expensive. The toy has high utility for the child, but the cost makes the probability of getting it extremely low.
Teenage Crush Example
A teenager wants affection to be mutual. Self-confidence may influence how likely they think that is, but desire and confidence do not establish the other person’s feelings. The example separates the value of an outcome from the estimate of its likelihood.
Normandy Invasion Example
The author uses the Normandy invasion to illustrate how motivation can lead people to change practical constraints. The Allies built artificial harbors to support landings where permanent port facilities were lacking. The engineering effort mattered; assigning high utility to the goal did not by itself make it likely to succeed.
A MOMENT TO REFLECT
Put it to work.
Think of a recent decision you made. How did you implicitly weigh utility and probability? How might separating them change your analysis?
In a group discussion, how often do people mix utility and probability? Can you identify instances where this caused confusion?
Consider a strategic decision like choosing a career. How would a utility matrix help you evaluate options?
Often confused with
CONTINUE THE CONVERSATION
Source texts
- The Thinkers Toolkit by Morgan D Jones