Utility-Tree Analysis for Securities Investment
A step-by-step utility-tree method for comparing investment options (speculative stocks, blue-chip stocks, government bonds) under uncertainty, using subjective utility values and probabilities to compute expected values and rank alternatives.
THE IDEA
EXERCISE 42 Securities Investment II
You are considering making a $5,000 lump-sum investment in one of the following three types of securities:
- Speculative high-risk stocks. They offer the possibility of earning more than the other two options but also are very risky; you could easily lose your investment if things don’t go just right.
- Blue-chip medium-risk stocks. They usually earn less than speculative stocks but are much safer.
- Government bonds. In this exercise, they have the safest stipulated payoff; their ranking by return depends on which scenario occurs.
In this hypothetical example, the value—the outcome—of the two stocks will vary according to what happens in three future scenarios: war, peace with prosperity, and peace with depression.
 The value of the speculative high-risk stock will increase 20 percent with the outbreak of hostilities, increase 1 percent with prosperity, and decrease 6 percent with depression.
The value of the blue-chip medium-risk stock will experience a healthy increase with either war (up 9 percent) or peace with prosperity (up 8 percent) but go nowhere (0 percent change) in a depression.
The exercise assumes that the bonds pay a guaranteed 4 percent return in every scenario.
The probability of war is .1, peace .9. If there is peace, the probability of prosperity is .4, depression .6. These probabilities apply to all three options.
Because this problem may seem a little tricky, let me walk you through the steps.
Step 1: Identify the options and outcomes to be analyzed.
There are three options (speculative stocks, blue-chip stocks, and government bonds) and three outcomes (war, peace with prosperity, peace with depression).
Step 2: Identify the perspective of the analysis.
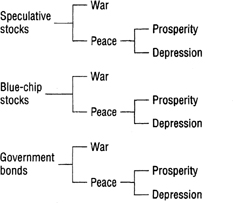
FIGURE 14-9
Write “Perspective: My monetary profit” above the set.
Step 3: Construct a scenario tree for each option.
Figure 14-9 shows the set of trees.
Step 4: Assign a utility value to each option-outcome combination—each branch (scenario) of the tree—by asking the Utility Question: If we select this option, and this outcome occurs, what is the utility from the perspective of …?
We now ask the Utility Question of each option-outcome combination (each scenario). We could, if we wished, compute the dollar earnings and losses in the value of the securities and use the resultant dollar figures as our utility values. But since the purchase price is the same for all, there’s a simpler, more direct way. Enter adjacent to each scenario (each branch) the percentage of increase or decrease in value that will accrue.
Figure 14-10 shows the percentages.
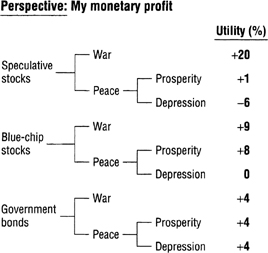
FIGURE 14-10
Now enter an adjective or adverb-adjective (such as “Best,” “Worst,” “Super,” “Rotten,” “Very good,” “Poor,” “Absolutely awful”) that best characterizes our subjective judgment concerning the utility of each percentage (each outcome) in comparison to all of the other outcomes. This is a critical feature of utility analysis. We are measuring the utility of all nine of the outcomes, not just the three in a single tree. Thus, we ask the Utility Question of the Speculative-War scenario: “If we invest in speculative stock and war occurs, what is the utility from the perspective of my monetary profits, that is, from a 20 percent increase in the value of the stock?” Our answer might be “Excellent,” which we would enter adjacent to the end of the scenario. So go ahead and ask the Utility Question of each scenario and enter your adjectival assessments of utility. (There is no “right” utility; enter whatever your intuition indicates.)
Figure 14-11 shows my adjectival assessments of the utilities in the tree.
In determining the utilities, you discovered, I’m sure, that you quickly perceived a ranking order among them. The mind senses this order instantly. We don’t have to consciously work at it. The ease with which we do it is, I’m sure, related to the mind’s instinct to view things chronologically and in terms of cause and effect. In any case, the mind is exquisitely equipped to perform this task. But let us get back to the process.
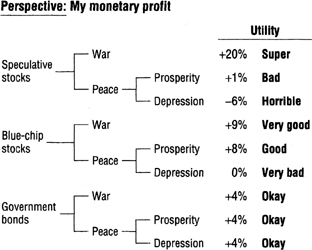
FIGURE 14-11
The trouble with using adjectives is that we can’t multiply them by probabilities to produce expected values. Adjectives don’t tell us numerically how much utility each scenario provides. To calculate expected value, we need somehow to quantify the adjectives. The numerical spacing needs to represent the strength of preferences, not just their order. Arbitrarily attaching scores to ranked adjectives does not establish a suitable expected-utility scale. For this exercise, we represent utility on a scale of 0 to 100, where 100 is the best utility among all the outcomes being considered. The utility numbers for all of the scenarios will lie somewhere on this spectrum of 0 to 100.
This brings up another rule regarding utility-tree analysis. Under the normalization used here, there must be at least one 100 in a set of trees (one best case). There can be more than one but never less than one 100. I say again: at least one 100. Why this rule? Because we need to establish an analytic boundary within which to compare the relative utilities of the various option-outcome combinations. Assigning at least one 100 to the set serves the purpose of setting the upper limit within which the utilities in this particular set will be compared.
Why put an artificial boundary on the utility judgments? Because the numbers we use to quantify utility are not real. (I’m not speaking here of those instances where we can use monetary values for utilities.) What does the 100 we assign as a utility represent? A hundred what? A hundred units of utility. What’s a unit of utility? It’s an abstraction that provides a common denominator for weighing one option-outcome combination against another. A unit of utility can’t be weighed or measured by any objective standard; it’s purely theoretical. Outside the set of trees, the utility we ascribe to an outcome has no meaning whatsoever. Imagine telling a business acquaintance that you are buying a particular computer because “it has a utility of 90”!
(There is a utility concept called “disutility” by which one assigns negative utility values from 0 to -100 to outcomes according to how undesirable they are. I haven’t yet found a practical use for this upside-down concept.)
In expressing utilities we should also observe another rule of thumb (I’m brimming over with rules): use only utility values divisible by 10 (such as 10, 40, 90, 100). There are three reasons:
- Utility values, being subjective, are by nature imprecise. Restricting these values to those divisible by 10 explicitly reaffirms that imprecision. To employ more precise numbers would suggest to ourselves and to others that there is some objective basis for greater precision. But in utility analysis there is no objective basis (unless, of course, we are using monetary values for utilities).
- Values in tens serve our purpose as well as more precise numbers.
- Values in tens are especially easy to work with arithmetically.
Let us return to our trees. Convert the adjectival expressions of utility into decimal numbers from 0 to 100. These are the utility values.
Figure 14-12 shows my conversions of adjectival expressions into decimal values from 0 to 100. As a practical matter, however, don’t use adjectives as an intermediate step to assigning utility values. I had you do that in this exercise only as a way of teaching you the technique. In the remaining exercises, and when you perform utility analysis on your own, go directly to decimal utility values. You don’t need the adjectives.
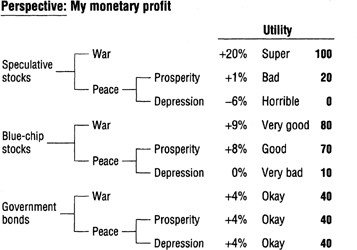
FIGURE 14-12
Step 5: Assign a probability to each outcome. Determine or estimate this probability by asking the Probability Question: If this option is selected, what is the probability this outcome will occur? The probabilities of all outcomes for a single option (in a single tree) must add up to 1.0.
Ordinarily, we would now ask the Probability Question in our problem, but, as the probabilities are given above, we can simply enter them at the appropriate places in the tree and calculate the probability of each scenario.
Figure 14-13 shows the probability entries.
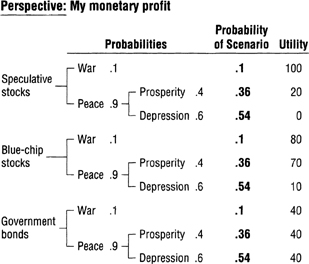
FIGURE 14-13
Step 6: Determine the expected values by multiplying each utility by its probability and then adding the expected values for each option.
Step 7: Determine the ranking of the alternative options.
Figure 14-14 shows the resulting expected values and rankings. With the author’s utility assignments and these probabilities, government bonds rank first, blue-chip stock second, and speculative stock third.
What if we change the probabilities? Let’s say war is .5, prosperity with peace .6, and depression with peace .4. Using these new probabilities, redo the computations and determine which investment is preferred under the different circumstances.
Figure 14-15 shows the results using the new probabilities. With the author’s utility assignments and these changed probabilities, blue-chip stocks rank first, speculative stocks second, and bonds third.
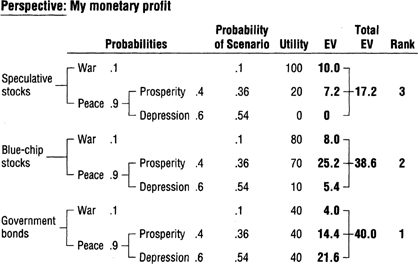
FIGURE 14-14
Step 8: Perform a sanity check.
Do the results make intuitive sense? I believe they do.
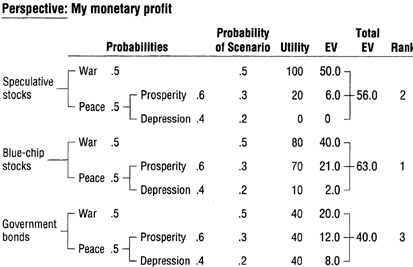
FIGURE 14-15
When to use it
Comparing different investment portfolios under various economic scenarios.
Evaluating business strategies (e.g., launching a new product) with uncertain market conditions.
Choosing between career paths with different risk-return profiles (e.g., stable job vs. startup).
Assessing insurance options by weighing premiums against potential losses.
FROM THEORY TO EVERYDAY LIFE
In practice
Comparing Speculative Stocks, Blue-Chip Stocks, and Bonds
In this hypothetical exercise, an investor has $5,000 to invest. Under war (10% probability), speculative stock gains 20%, blue-chip gains 9%, bonds give 4%. Under peace with prosperity (40% of peace, 36% overall), speculative gains 1%, blue-chip gains 8%, bonds 4%. Under peace with depression (60% of peace, 54% overall), speculative loses 6%, blue-chip 0%, bonds 4%. Using subjective utility values (e.g., 100 for speculative-war, 10 for speculative-depression), the author’s full set of assigned utilities puts bonds first. Changing probabilities (war 50%, peace prosperity 30%, peace depression 20%) puts blue-chip stocks first with those utility assignments. The rankings are based on the chosen utility scale, not percentage returns alone.
A MOMENT TO REFLECT
Put it to work.
How would your utility assessments change if you were a risk-seeking versus a risk-averse investor?
In what real-life investment decisions could you apply the utility-tree method to compare options with uncertain outcomes?
Why might using only monetary values as utilities be insufficient for capturing a decision-maker's true preferences?
Often confused with
CONTINUE THE CONVERSATION
Source texts
- The Thinkers Toolkit by Morgan D Jones