Linear Extrapolation Fallacy (Ignoring Upper Bounds)
The linear extrapolation fallacy occurs when trends are projected linearly past natural limits, such as percentages exceeding 100% or impossible values, leading to absurd predictions. This mistake ignores constraints that cause growth to slow or plateau.
THE IDEA
BACK TO THE OBESITY APOCALYPSE
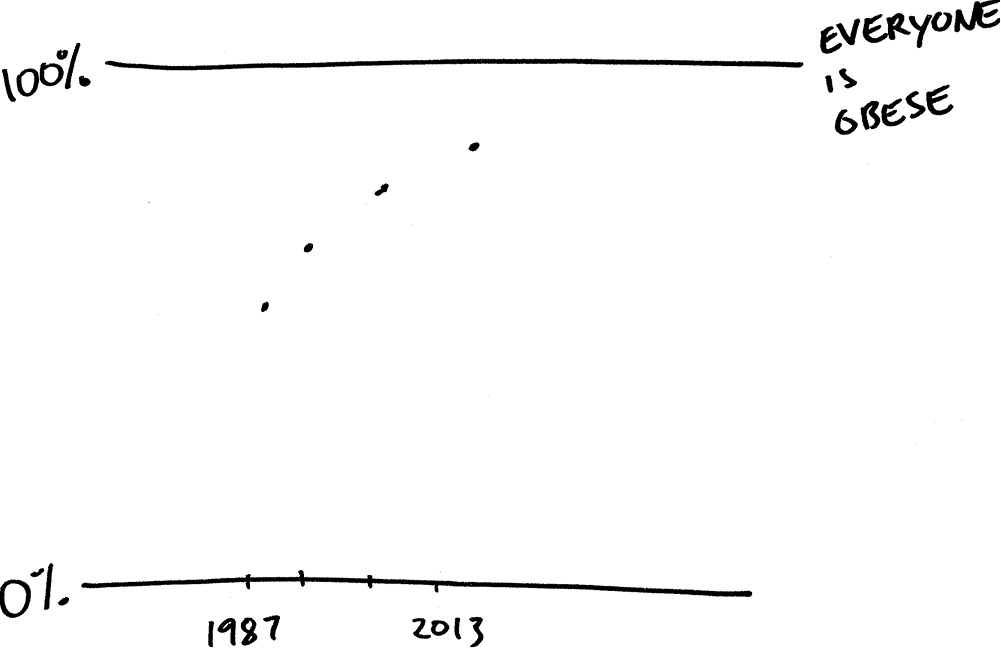
So what percentage of Americans are going to be overweight in 2048? You can guess by now how Youfa Wang and his Obesity coauthors generated their projection. The National Health and Nutrition Examination Survey, or NHANES, tracks the health data of a large, representative sample of Americans, covering everything from hearing loss to sexually transmitted infections. In particular, it gives very good data for the proportion of Americans who are overweight, which for present purposes is defined as having a body-mass index of 25 or higher.* There’s no question that the prevalence of overweight has increased in recent decades. In the early 1970s, just under half of Americans had a BMI that high. By the early 1990s that figure had risen to almost 60%, and by 2008 almost three-quarters of the U.S. population was overweight.
You can plot the prevalence of overweight against time:
And you can generate a linear regression, which will look something like this:
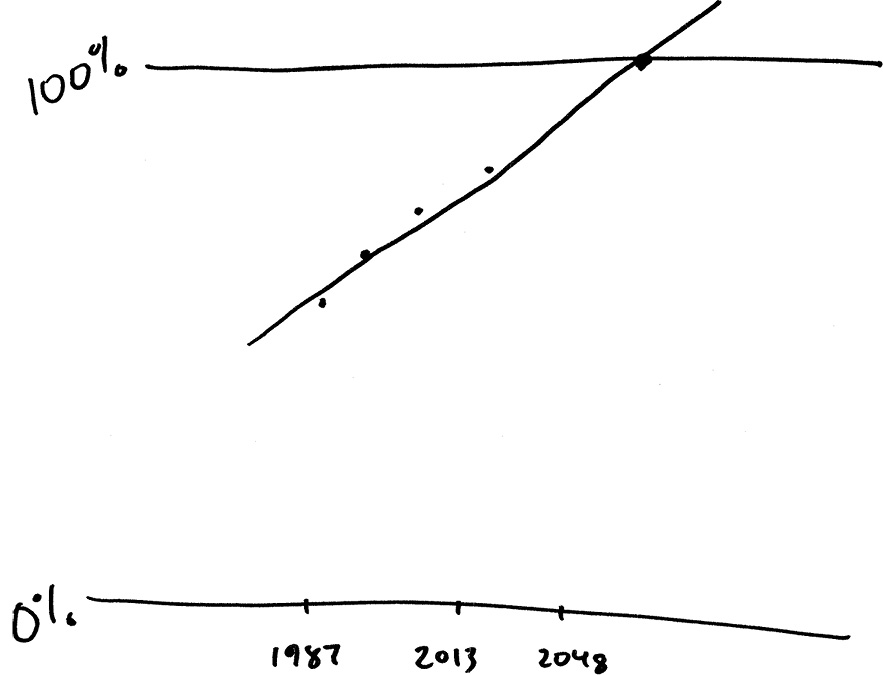
In 2048, the line crosses 100%. And that’s why Wang writes that all Americans will be overweight in 2048, if current trends continue.
But current trends will not continue. They can’t! If they did, by 2060, a whopping 109% of Americans would be overweight.
In reality, the graph of an increasing proportion bends toward 100%, like this:
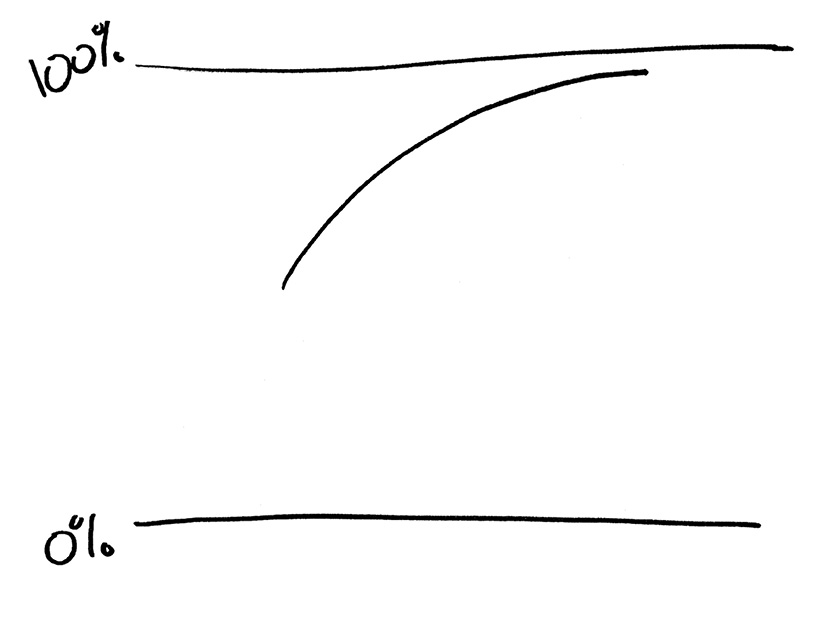
That’s not an ironclad law, like the gravity that bends the missile’s path into a parabola, but it’s as close as you’re going to get in medicine. The higher the proportion of overweight people, the fewer skinny malinkies are left to convert, and the more slowly the proportion increases toward 100%. In fact, the curve probably goes horizontal at some point below 100%. The thin we have always with us! And indeed, just four years later, the NHANES survey showed that the upward march of overweight prevalence had already begun to slow.
But the Obesity paper conceals a worse crime against mathematics and common sense. Linear regression is easy to do—and once you’ve done one, it’s cake to do more. So Wang and company broke down their data by ethnic group and sex. Black men, for instance, were less likely to be overweight than the average American; and, more important, their rate of overweight was growing only half as quickly. If we superimpose the proportion of overweight black men on the proportion of overweight Americans overall, together with the linear regressions Wang et al. worked out, we get a picture that looks like this.
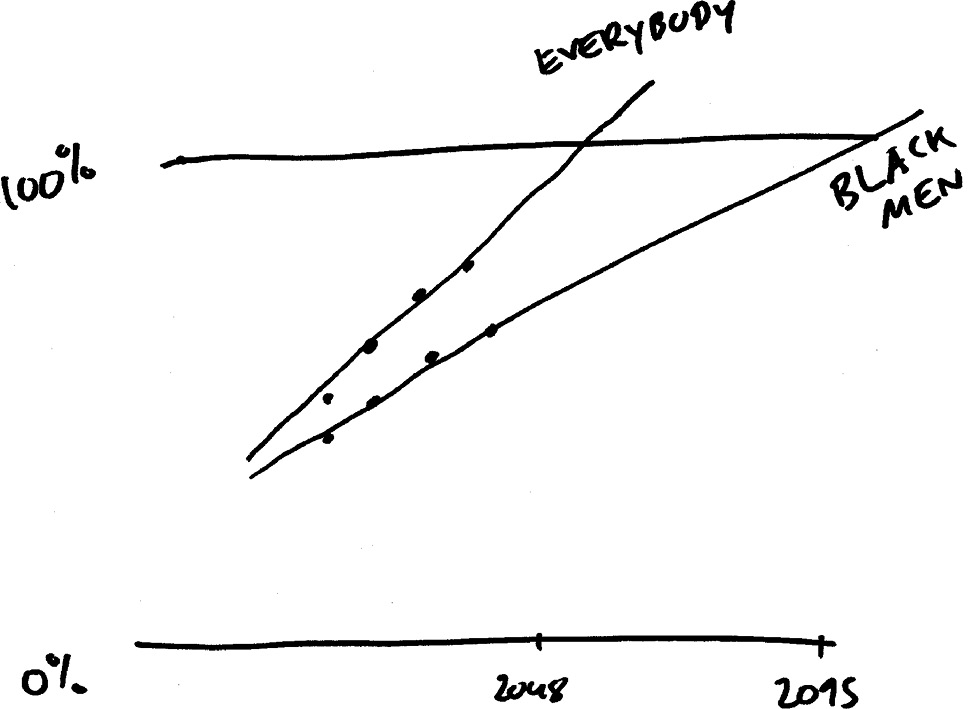
Nice work, black men! Not until 2095 will all of you be overweight. In 2048, only 80% of you will be.
See the problem? If all Americans are supposed to be overweight in 2048, where are those one in five future black men without a weight problem supposed to be? Offshore?
That basic contradiction goes unmentioned in the paper. It’s the epidemiological equivalent of saying there are −4 grams of water left in the bucket. Zero credit.
When to use it
Evaluating forecasts of social media user growth to check if they account for total population.
Analyzing student test score improvements over time, considering that scores cannot exceed 100%.
Projecting sales of a new product in a saturated market.
Assessing medical treatment efficacy where patient recovery rates cannot exceed 100%.
FROM THEORY TO EVERYDAY LIFE
In practice
Obesity Projections by Wang et al.
The study by Youfa Wang and colleagues used linear regression on NHANES data to predict that 100% of Americans would be overweight by 2048. This ignored the natural upper bound of 100% and the fact that different subgroups would reach 100% at different times, creating an internal contradiction.
Market Share Projection
Suppose a company already has some market share and gains a further 5% of the entire market each year. Continuing that linear trend would push its share above 100% within 20 years. The forecast must change before that point because a share cannot exceed 100%.
A MOMENT TO REFLECT
Put it to work.
Think of a prediction you have heard that relied on a linear trend. What constraints or limits might cause that trend to slow or stop?
Why is it important to consider the ceiling or floor effects when making projections?
How can you recognize when a linear extrapolation is likely to be flawed?
CONTINUE THE CONVERSATION
Source texts
- How Not to Be Wrong The Power of Mathematical Thinking (Ellenberg, Jordan)