Data Cleansing and Normalization
Data preparation includes checking missing entries, correcting errors, and investigating unusual values. Imputation fills gaps under explicit assumptions; outlier screening flags observations for review. Neither filling every gap nor removing every extreme value guarantees a sound analysis.
THE IDEA
Cleansing & Structuring
Operational data often need repair before analysis. Check for missing entries, inconsistent formats, recording errors, and unusual values. This account uses normalization broadly to include outlier checks and adjustments to distributions.10 Those checks should be guided by the planned analysis and the meaning of the data.
Data Repairing
Start by measuring completeness for each variable. If an extract contains 1,000 records and 100 variables, how many entries are missing for each of the 100 variables across those 1,000 records? Also inspect which records and groups account for the gaps.
An extract need not be 100% complete to be useful. Missing entries can result from recording errors, technical failures, unanswered questions, or a measure not applying to a record. These causes matter. Deleting incomplete records may reduce the sample and can introduce bias when missingness is related to the variables under study. Even when entries are missing completely at random, deletion can leave too little information for a precise analysis. Some methods can use incomplete records directly; others require an explicit strategy for missing values.
There is no universal missingness rate at which a variable becomes unusable. The decision depends on why values are missing, how much information remains, and what the analysis requires. A normal distribution of observed values does not establish a missing-data cutoff. A defensible choice should explain the assumptions and examine how the result changes under plausible alternatives.
Figure 8.1 depicts a standard normal distribution. Roughly two-thirds of its observations fall within ±1 standard deviation of the mean, about 95% within ±2, and more than 99% within ±3. These are statements about a distribution’s values, not about how much missing data can safely be filled in. The 95% and 99% coverage figures therefore do not justify an exclusion threshold. The author proposes retaining variables with fewer than 32% missing entries and excluding those missing roughly one-third or more. Treat that proposal as a rule of thumb to assess, not a guarantee that imputation preserves a variable’s distribution.
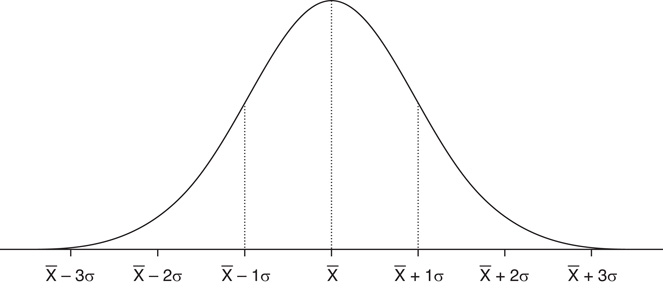
FIGURE 8.1 Standard Normal Distribution.
Imputation replaces missing entries using external information or patterns in the observed data. In the constant-fill version of cold deck imputation described here, the same externally derived value fills many gaps. Mean imputation similarly uses the observed mean. Both are easy to apply, but repeated constants can understate variability and distort relationships between variables. Cold deck methods need not always use a single constant, and no method is preferable solely because it is more complex.
Regression-based imputation predicts a missing entry from other variables. It uses more of the available information than filling every gap with a constant, but its usefulness depends on the model and the missingness assumptions. Filling gaps with fitted predictions alone can make relationships appear too strong and understate variation. Adding stochastic variation addresses part of that problem; the uncertainty in estimating the model must also be considered.
Likelihood-based and Bayesian methods offer other ways to use incomplete data. A likelihood approach can estimate model parameters from the observed data without necessarily filling every missing cell. A Bayesian approach can model the joint uncertainty in parameters and missing values. Statistical software can implement these methods, but computation does not settle whether the model or missingness assumptions are appropriate. There is no universally most robust replacement method.
Data Normalization
An outlier is unusual relative to the data, model, or context being examined. It may be an error or a valid but rare observation. Scatterplots and distribution-based rules, such as flagging values beyond ±3 standard deviations, can identify cases for review. Investigate what each flagged value represents before changing or removing it. Also distinguish an unusual response value from high leverage in a regression: leverage concerns a point’s position among the predictors, while its influence on a fitted result depends on more than distance from a mean.
Extreme observations can distort the mean and standard deviation used to detect them, masking other unusual points. A trimmed mean, calculated after setting aside the lower and upper 5%–10% of observations, can reduce that sensitivity. It does not guarantee that every outlier is found. Trimming to estimate a reference value is also different from deleting those records from the analysis.
Choose a screening threshold that fits the distribution and purpose of the analysis. The phrase 95% significance level confuses different concepts: for a normal distribution, approximately that proportion of values lies within ±2 standard deviations of the mean. This is not a test of a parameter’s validity. A standard-deviation rule can be used as a preliminary screen, with the following assumptions made explicit:
- Step 1: Compute the mean and the standard deviation of the variable of interest.
- Step 2: Choose screening limits. For normally distributed values, 2 standard deviations cover about 95% of observations and 3 cover more than 99%. These coverage statements need not hold for other distributions.
- Step 3: Compute the maximum allowable upper values: mean + upper allowable limit and the maximum allowable lower values: mean – lower allowable limit.
- Step 4: Flag values outside the range for investigation. Correct, retain, transform, or exclude them only with a reason appropriate to the analysis.
When to use it
Examining missing survey responses and testing how different ways of handling them affect the analysis.
Investigating unusual financial transactions to distinguish recording errors, legitimate extremes, and possible fraud.
Cleaning sensor data from IoT devices with missing readings due to network glitches.
Planning how to handle missing measurements and unusual values before analyzing a study’s results.
FROM THEORY TO EVERYDAY LIFE
In practice
Cold Deck Imputation
In a customer database where income data is missing for many records, an analyst uses the average income from a previous year's census as a constant to fill in all missing values. While simple, this artificially reduces variability and may bias results.
Outlier Detection with Standard Deviation
An analyst flags salaries more than 3 standard deviations from the mean. The flag identifies values to investigate, not values to delete automatically. A high salary may be a valid observation, and a skewed salary distribution may make this screening rule a poor fit.
A MOMENT TO REFLECT
Put it to work.
What assumptions does each imputation method make, and how would you assess the effect of those assumptions on your result?
How much information would be lost by excluding an incomplete variable? How would you test whether retaining it changes your conclusions?
In what scenarios might outlier removal introduce bias rather than improve analysis?
CONTINUE THE CONVERSATION
Source texts
- Evidence-Based Decision-Making How to Leverage Available Data and Avoid Cognitive Biases (Andrew D. Banasiewicz)