Contrast as Context
A comparison gives a number or image context. Choose contrasts that answer the reader’s question, such as changes over time, differences between regions, or performance against a relevant benchmark.
THE IDEA
A number often becomes more informative when we compare it with another period, place, or group. The comparison need not involve opposites: a small difference may matter if it answers the question we are investigating. Showing useful comparisons is a central task of what is called “data visualization.”
In Beautiful Evidence, Edward Tufte explains the logic behind visual representations of data:
The fundamental analytical act in statistical reasoning is to answer the question “Compared with what?” Whether we are evaluating changes over space or time, searching big databases, adjusting and controlling for variables, designing experiments, specifying multiple regressions, or doing just about any kind of evidence-based reasoning, the essential point is to make intelligent and appropriate comparisons. Thus visual displays, if they are to assist thinking, should show comparisons.[8]
Knowing there were one hundred car accidents last year leaves important questions unanswered. Mapping them can reveal clusters; comparing periods can show changes. To judge how risky a road is, we also need information such as traffic volume, since a busy road may have more accidents without a higher accident rate.
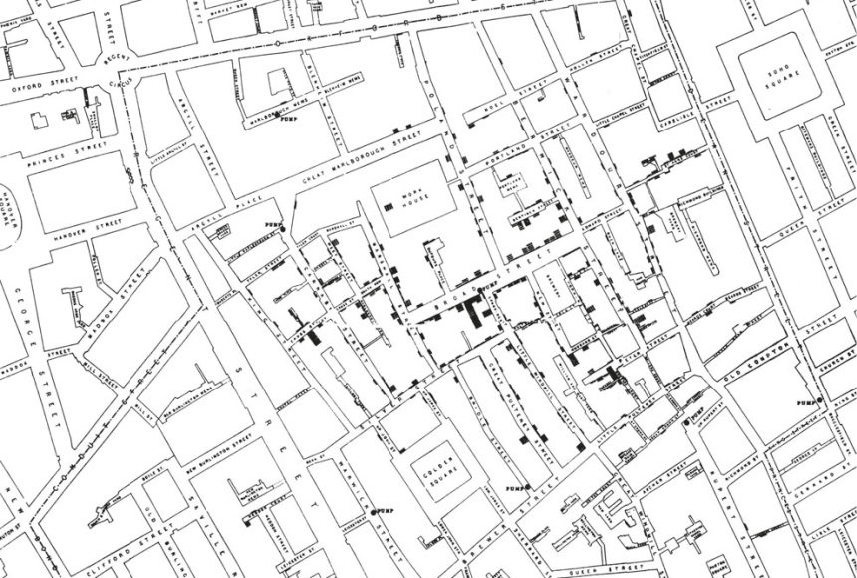
One of the classic images in data visualization is John Snow’s plotting of cholera victims in London in 1854. It’s simple but effective. The visual representation is clear and easy for the eye to process. The locations of cholera deaths are plotted geographically, and the contrast between regions of high mortality and low mortality is easily understood. The information conveyed by Snow’s visualization allowed for clear and immediate action to try to remedy the cholera problem.
In The Visual Display of Quantitative Information, Tufte asserts, “Graphical displays should encourage the eye to compare different pieces of data and reveal the data at several levels of detail, from a broad overview to the fine structure.”[10] A display should make the relevant similarities and differences easy to see.
When approaching data visualizations, Tufte argues that we shouldn’t start with wanting to use a particular image or color. He says, “The first question in constructing analytical displays is…what are the content-reasoning tasks that this display is supposed to help with?”[11] For a display about commercial fishing, for example, we might need fish-stock estimates over time alongside fishing pressure and other relevant changes. Tufte asserts that “data-rich designs give context and credibility to statistical evidence.”[12]
Providing context requires avoiding clutter. Contrasting data with irrelevant information, designs, or images is useless. And simply making something a different color is not the kind of contrast we’re talking about. According to scholars Tim Riffe, Nikola Sander, and Sebastian Klüsener, “Good visualizations enhance our understanding of the underlying data and grab the reader’s attention without sacrificing truth for beauty”[13]—essentially, pretty is not the same as engaging. As Tufte stresses, ink should be devoted primarily to the data needed to tell the story. “If the intellectual task is to make comparisons, as it is in nearly all data analysis,” Tufte writes, “then ‘show comparisons’ is the design principle.”[14]
It’s surprising how many people don’t understand how to apply contrast to their advantage. Hot business ideas that are attracting the best and brightest in an industry are seldom the most attractive field to enter. No matter how talented you are, your talent will always be compared with that of your rivals. In a room full of sneezers, it’s hard to stand out. Unpopular fields, in contrast, can offer a better chance to stand out.
When to use it
A data analyst presenting quarterly sales: instead of a single number, show a line chart comparing performance across regions and over time.
A product manager deciding on feature development: contrasting usage patterns between power users and casual users to prioritize improvements.
A journalist writing an article on climate change: comparing temperature trends across decades and geographies to illustrate the pace of change.
An investor evaluating a startup: comparing the startup's traction to industry benchmarks and similar companies to gauge its potential.
FROM THEORY TO EVERYDAY LIFE
In practice
Car Accidents Over Time and Place
A total of 100 car accidents says little about where they happened. Mapping locations and comparing periods can reveal clusters and changes. Traffic volume is also needed to compare accident rates rather than counts alone.
John Snow's Cholera Map
In 1854, John Snow mapped cholera deaths in London. The concentration of deaths near the Broad Street pump helped him investigate a possible waterborne source and make the case for intervention.
Choosing a Niche in Business
Hot industries attract so much talent that competition makes it hard to stand out. In contrast, unglamorous or unpopular fields often offer more opportunity to differentiate and succeed.
A MOMENT TO REFLECT
Put it to work.
When analyzing a dataset, what comparison would most meaningfully reveal the underlying story?
In what area of your life or work could you introduce a 'compared with what?' question to clarify a decision?
How can you apply contrast to make your next presentation or report more insightful for your audience?
References
- Beautiful Evidence — Edward Tufte (2006)
- The Visual Display of Quantitative Information — Edward Tufte (2001)
CONTINUE THE CONVERSATION
Source texts
- The Great Mental Models Volume 4 Economics and Art