Addressing Dilemmas and Managing Trade-offs
A framework using spider diagrams to explicitly capture and weigh trade-offs between competing priorities, such as cost vs. quality, to inform better decision-making in contexts like outsourcing or call center management.
THE IDEA
Addressing Dilemmas and Managing Trade‐Offs
I worked with an international organisation trying to get to the heart of some problems they had experienced in customer services that had not been resolved satisfactorily.
In summary, we looked at how call centre staff were measured and some of the dilemmas that call centre staff faced. We agreed there needed to be a more explicit framework to allow for trade‐offs between one choice and another. For example, there was a general desire that staff should ‘stick to the call script’ (which was in place to encourage consistency) and to ‘clear the call quickly’ (to drive productivity), but this sometimes conflicted with the need to take time to tailor the right solution for a customer who had had a significant or unusual complaint.
In the end, we recognised that (i) time targets for clearing calls quickly needed to be matched to the difficulty of the call that was being handled, not just a ‘one size fits all’ time target, and (ii) sometimes it was preferable to ‘fail to meet’ some targets, to deal with a difficult complaint (that might otherwise escalate internally and/or externally).
Finally, changes were made to how metrics were set, and extra guidance was given to call handlers so they could feel empowered to do what was suitable rather than being made to operate like robots. The organisation also reported a more enjoyable working environment and lower staff turnover, which helped preserve experience in the call centre.
Dilemmas can be found when you are making an outsourcing decision; on the one hand, you may want to save money, but there may be a risk of more variable quality from the third party, along with a range of other risks. Diagram 11.2 illustrates, through a ‘spider diagram’, how to capture different requirements and illustrate how different suppliers may be more or less expensive but also vary in their product quality or environmental track record, etc.
When choosing a supplier, make the trade-offs explicit. If a lower price comes with weaker quality controls or environmental safeguards, include the additional oversight in the comparison.
The elements in a spider diagram can vary with the decision. Comparing them helps people discuss which trade-offs they are willing to accept. After all, in day‐to‐day life, we think nothing of weighing up pros and cons when buying a new washing machine or car (e.g. we consider the cost, reliability, etc.), and recognise the cheapest option isn't always the most sensible choice. And here, we may see a contrast between the conversations we have in daily life and what might be said at work, where in some contexts, the cheapest choice will invariably be the preference, ignoring or downplaying concerns about quality. This contrast in what gets said and how decisions are made between the home and work environments illustrates how systemic factors (such as goals, budgets, and politics) can constrain or warp what would otherwise be common‐sense conversations and choices.
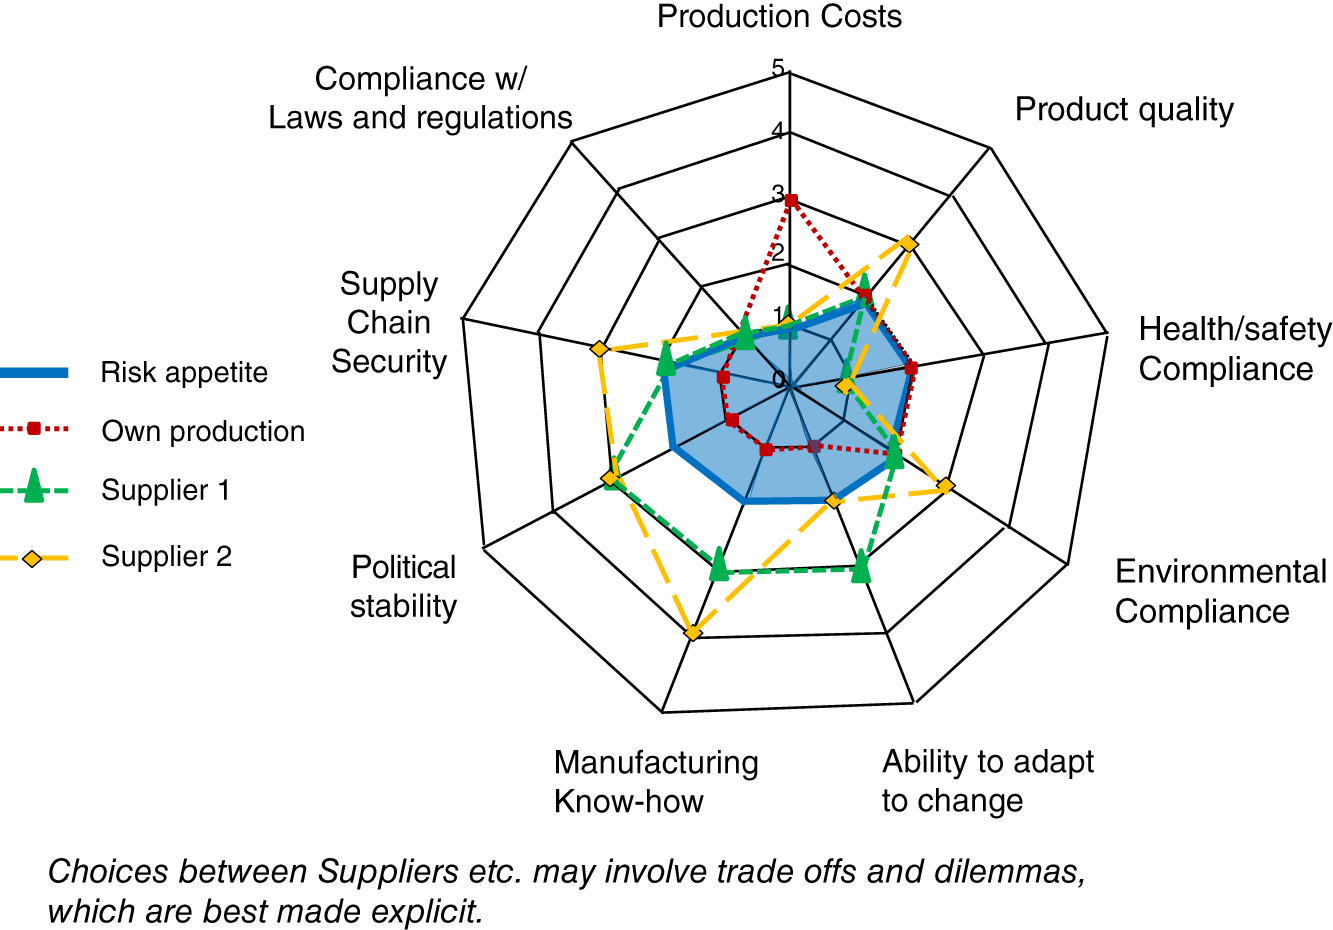
Diagram 11.2 Outsourcing – tensions in what is wanted.
When to use it
Setting performance metrics for teams where conflicting goals exist (e.g., speed vs. quality).
Evaluating suppliers or vendors by comparing multiple criteria (cost, quality, risk, sustainability).
Making project prioritization decisions when resources are limited and different dimensions (value, effort, risk) must be balanced.
Designing employee incentive systems that recognize when it is appropriate to 'fail' one metric to achieve a more important outcome.
FROM THEORY TO EVERYDAY LIFE
In practice
Call center trade-off: script adherence vs. call speed vs. customer care
Call center staff faced conflicting goals: stick to the call script for consistency, clear calls quickly for productivity, and spend extra time tailoring solutions for customers with unusual complaints. The framework recognized that time targets should match call difficulty, and sometimes it's better to 'fail' on metrics to resolve a difficult complaint, reducing escalation risk and staff turnover.
Outsourcing decision: cost vs. quality vs. risk
When choosing a supplier, cheaper options may bring variable quality and environmental risks. A spider diagram captures multiple requirements (cost, quality, environmental track record) to visualize trade-offs, showing where a proposed saving might come with risks that require extra oversight.
A MOMENT TO REFLECT
Put it to work.
Identify a recent decision at work where two or more metrics conflicted. How did you handle the trade-off? Could a spider diagram have helped?
Think of a common-sense choice you made at home (e.g., buying a car) that considered multiple factors. Compare it to a similar decision at work that was driven by a single metric. What systemic factors caused the difference?
When faced with a dilemma, which stakeholders are affected by each trade-off? How would you capture their priorities in a spider diagram?
CONTINUE THE CONVERSATION
Source texts
- Beyond the Five Whys Root Cause Analysis and Systems Thinking (James C. Paterson)