A System with Delays—Business Inventory
Delays in balancing feedback loops can cause oscillations, as in a car dealership’s inventory. When exponential growth is constrained by a nonrenewable resource, the system can instead reach a peak and decline, as in an oil extraction model.
THE IDEA
A System with Delays—Business Inventory
Picture a stock of inventory in a store—a car dealership—with an inflow of deliveries from factories and an outflow of new car sales. By itself, this stock of cars on the dealership lot would behave like the water in a bathtub.
Now picture a regulatory feedback system designed to keep the inventory high enough so that it can always cover ten days’ worth of sales (see Figure 29). The car dealer needs to keep some inventory because deliveries and purchases don’t match perfectly every day. Customers make purchases that are unpredictable on a day-to-day basis. The car dealer also needs to provide herself with some extra inventory (a buffer) in case deliveries from suppliers are delayed occasionally.
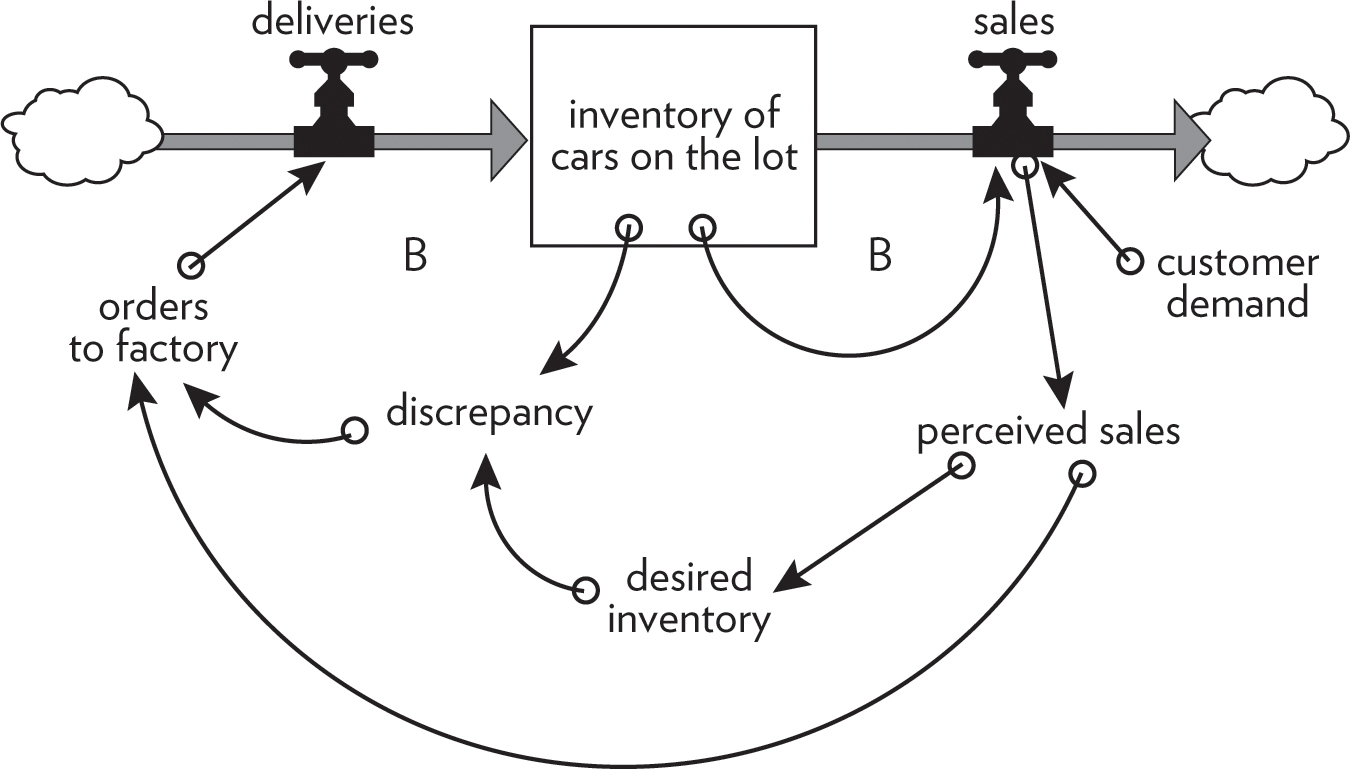
Figure 29. Inventory at a car dealership is kept steady by two competing balancing loops, one through sales and one through deliveries.
The dealer monitors sales (perceived sales), and if, for example, they seem to be rising, she adjusts orders to the factory to bring inventory up to her new desired inventory that provides ten days’ coverage at the higher sales rate. So, higher sales mean higher perceived sales, which means a higher discrepancy between inventory and desired inventory, which means higher orders, which will bring in more deliveries, which will raise inventory so it can comfortably supply the higher rate of sales.
This system is a version of the thermostat system—one balancing loop of sales draining the inventory stock and a competing balancing loop maintaining the inventory by resupplying what is lost in sales. Figure 30 shows the not very surprising result of an increase in consumer demand of 10 percent.
In Figure 31, I am putting something else into this simple model—three delays that are typical of what we experience in the real world.
First, there is a perception delay, intentional in this case. The car dealer doesn’t react to just any blip in sales. Before she makes ordering decisions, she averages sales over the past five days to sort out real trends from temporary dips and spikes.
Second, there is a response delay. Even when it’s clear that orders need to be adjusted, she doesn’t try to make up the whole adjustment in a single order. Rather, she makes up one-third of any shortfall with each order. Another way of saying that is, she makes partial adjustments over three days to be extra sure the trend is real. Third, there is a delivery delay. It takes five days for the supplier at the factory to receive an order, process it, and deliver it to the dealership.
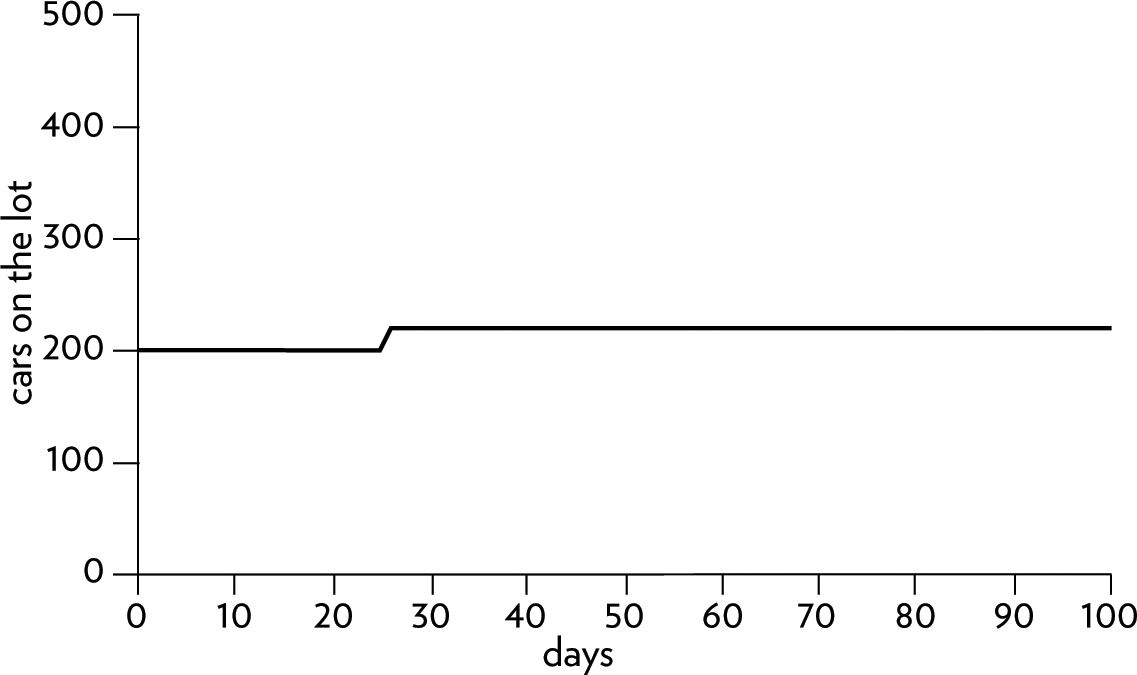
Figure 30. Inventory on the car dealership’s lot with a permanent 10-percent increase in consumer demand starting on day 25.
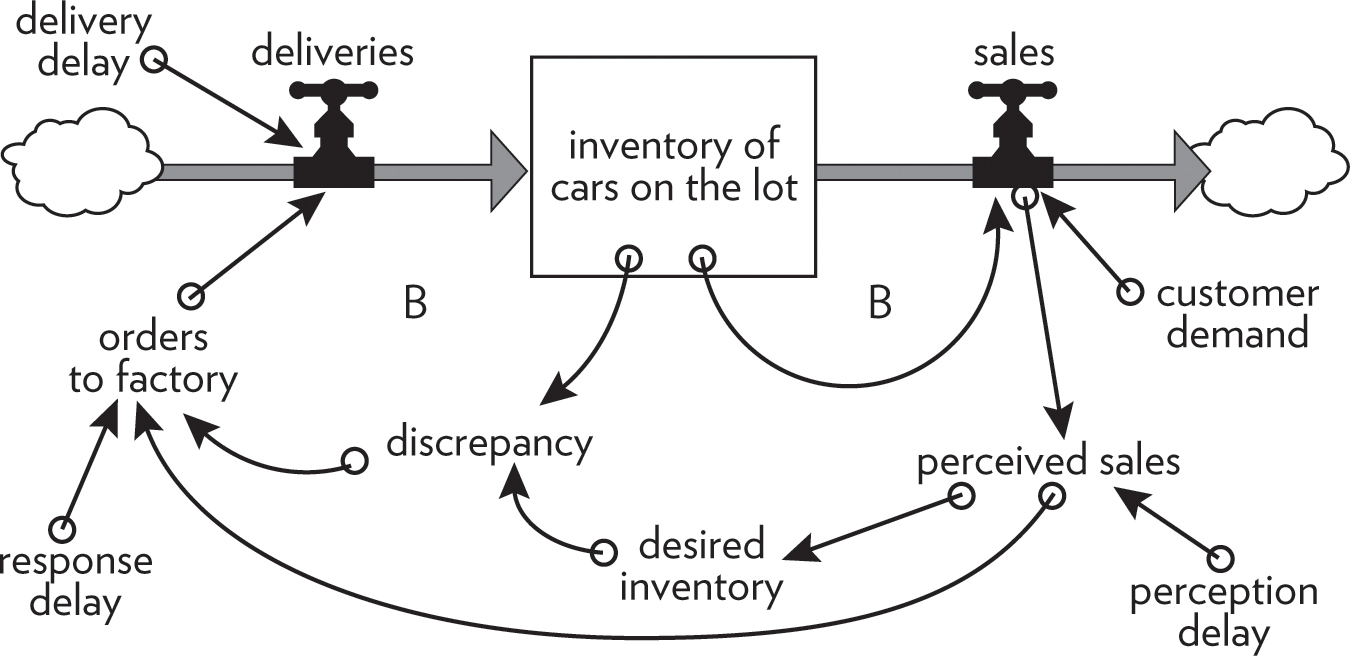
Figure 31. Inventory at a car dealership with three common delays now included in the picture—a perception delay, a response delay, and a delivery delay.
Although this system still consists of just two balancing loops, like the simplified thermostat system, it doesn’t behave like the thermostat system. Look at what happens, for example, as shown in Figure 32, when the business experiences the same permanent 10-percent jump in sales from an increase in customer demand.
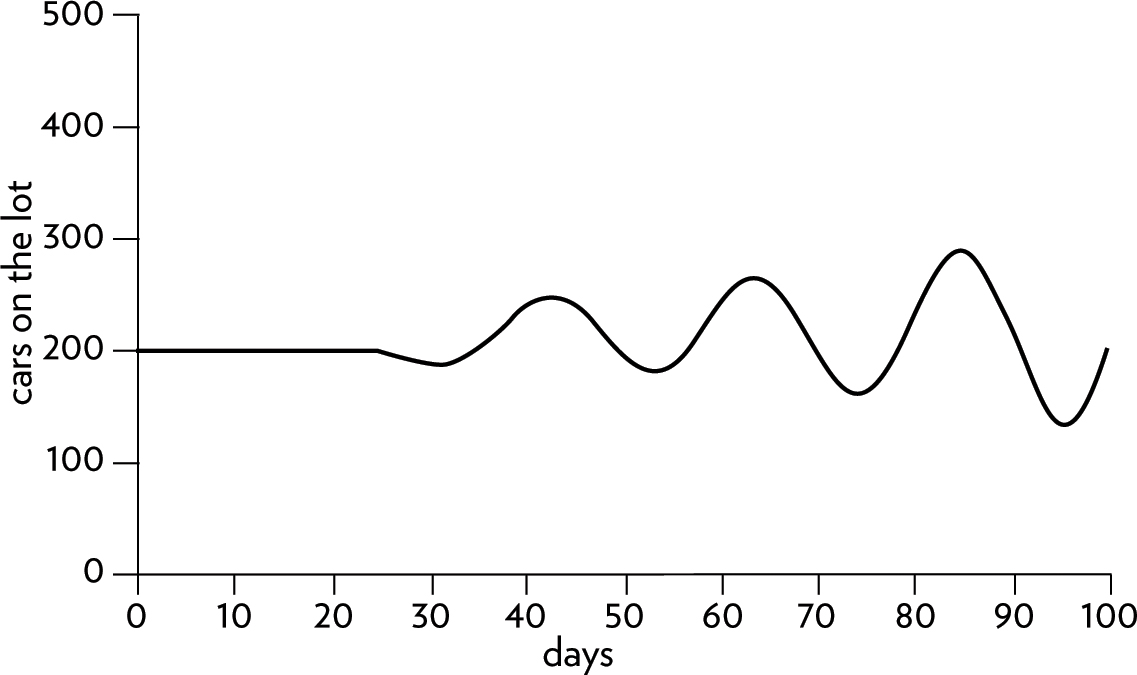
Figure 32. Response of inventory to a 10-percent increase in sales when there are delays in the system.
Oscillations! A single step up in sales causes inventory to drop. The car dealer watches long enough to be sure the higher sales rate is going to last. Then she begins to order more cars to both cover the new rate of sales and bring the inventory up. But it takes time for the orders to come in. During that time inventory drops further, so orders have to go up a little more, to bring inventory back up to ten days’ coverage.
Eventually, the larger volume of orders starts arriving, and inventory recovers—and more than recovers, because during the time of uncertainty about the actual trend, the owner has ordered too much. She now sees her mistake, and cuts back, but there are still high past orders coming in, so she orders even less. In fact, almost inevitably, since she still can’t be sure of what is going to happen next, she orders too little. Inventory gets too low again. And so forth, through a series of oscillations around the new desired inventory level. As Figure 33 illustrates, what a difference a few delays make!
We’ll see in a moment that there are ways to damp these oscillations in inventory, but first it’s important to understand why they occur. It isn’t because the car dealer is stupid. It’s because she is struggling to operate in a system in which she doesn’t have, and can’t have, timely information and in which physical delays prevent her actions from having an immediate effect on inventory. She doesn’t know what her customers will do next. When they do something, she’s not sure they’ll keep doing it. When she issues an order, she doesn’t see an immediate response. This situation of information insufficiency and physical delays is very common. Oscillations like these are frequently encountered in inventories and in many other systems. Try taking a shower sometime where there’s a very long pipe between the hot- and cold-water mixer and the showerhead, and you’ll experience directly the joys of hot and cold oscillations because of a long response delay.
A delay in a balancing feedback loop makes a system likely to oscillate.
How much of a delay causes what kind of oscillation under what circumstances is not a simple matter. I can use this inventory system to show you why.
“These oscillations are intolerable,” says the car dealer (who is herself a learning system, determined now to change the behavior of the inventory system). “I’m going to shorten the delays. There’s not much I can do about the delivery delay from the factory, so I’m going to react faster myself. I’ll average sales trends over only two days instead of five before I make order adjustments.”
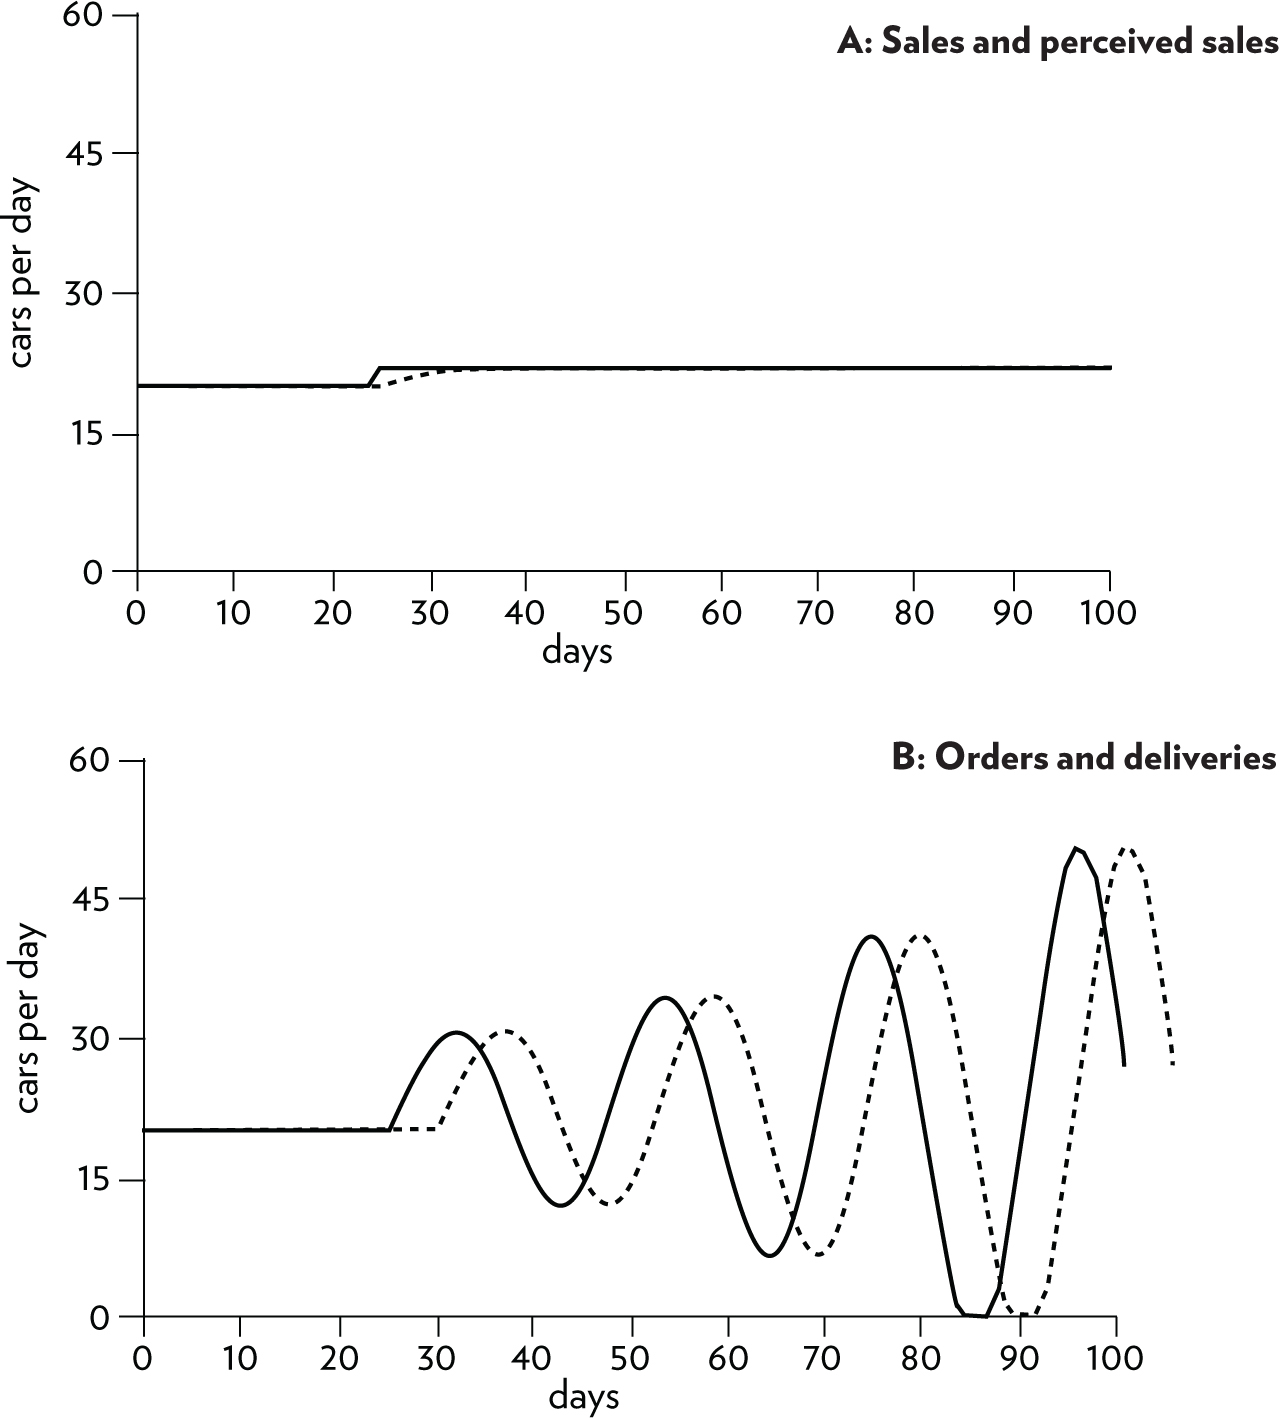
Figure 33. The response of orders and deliveries to an increase in demand. A shows the small but sharp step up in sales on day 25 and the car dealer’s “perceived” sales, in which she averages the change over 3 days. B shows the resulting ordering pattern, tracked by the actual deliveries from the factory.
Figure 34 illustrates what happens when the dealer’s perception delay is shortened from five days to two.
Not much happens when the car dealer shortens her perception delay. If anything the oscillations in the inventory of cars on the lot are a bit worse. And if, instead of shortening her perception time, the car dealer tries shortening her reaction time—making up perceived shortfalls in two days instead of three—things get very much worse, as shown in Figure 35.
Something has to change and, since this system has a learning person within it, something will change. “High leverage, wrong direction,” the system-thinking car dealer says to herself as she watches this failure of a policy intended to stabilize the oscillations. This perverse kind of result can be seen all the time—someone trying to fix a system is attracted intuitively to a policy lever that in fact does have a strong effect on the system. And then the well-intentioned fixer pulls the lever in the wrong direction! This is just one example of how we can be surprised by the counterintuitive behavior of systems when we start trying to change them.
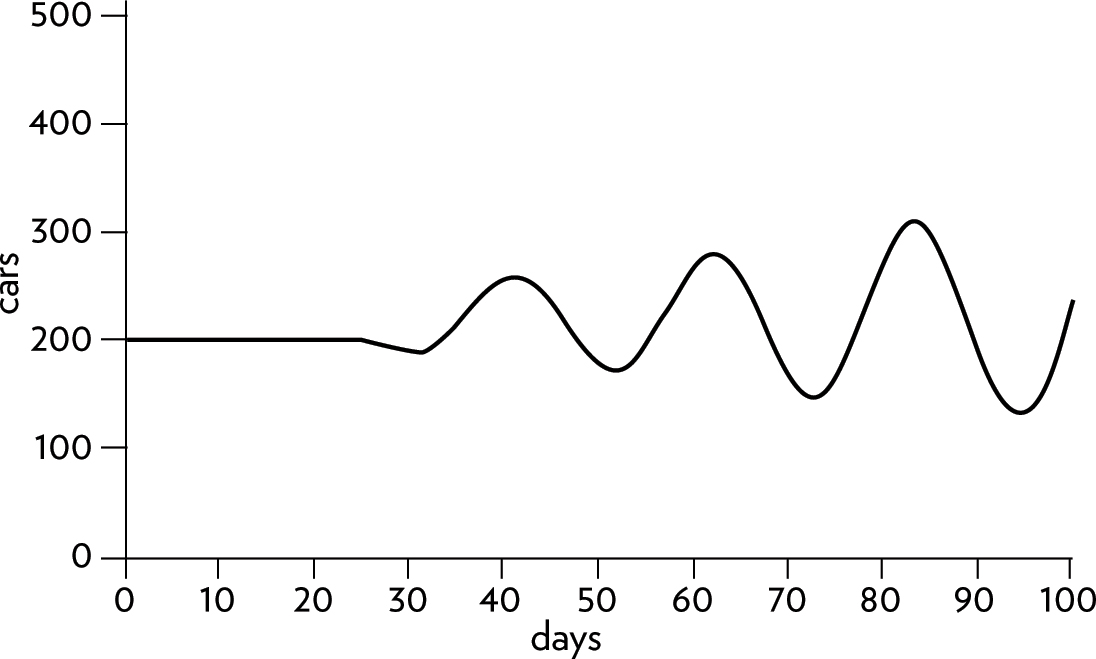
Figure 34. The response of inventory to the same increase in demand with a shortened perception delay.
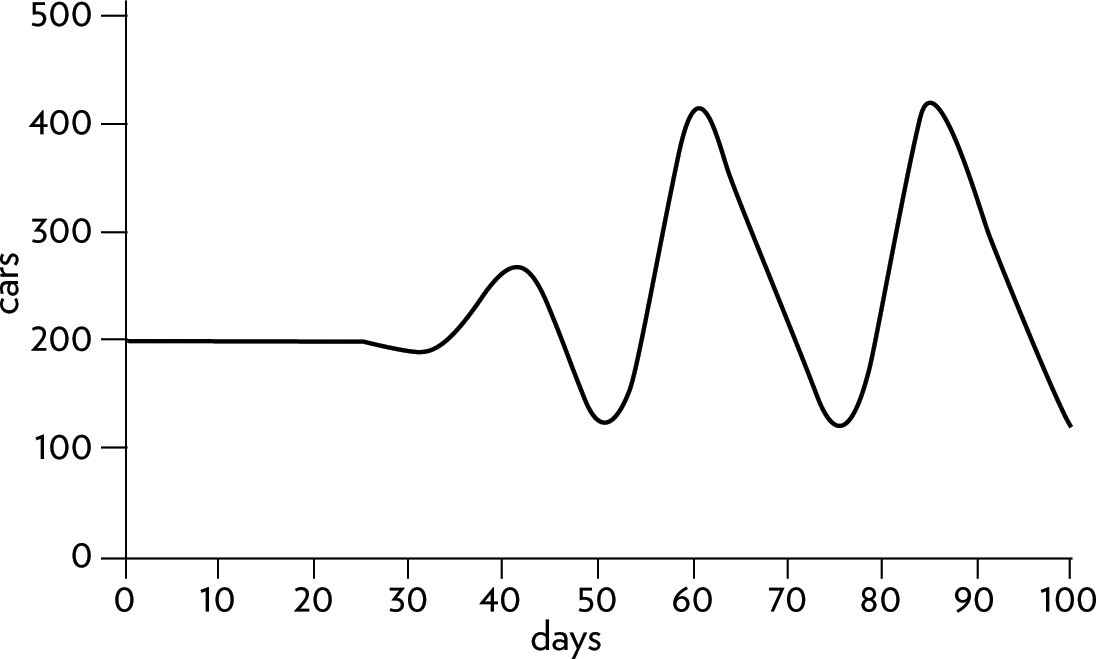
Figure 35. The response of inventory to the same increase in demand with a shortened reaction time. Acting faster makes the oscillations worse!
Part of the problem here is that the car dealer has been reacting not too slowly, but too quickly. Given the configuration of this system, she has been overreacting. Things would go better if, instead of decreasing her response delay from three days to two, she would increase the delay from three days to six, as illustrated in Figure 36.
As Figure 36 shows, the oscillations are greatly damped with this change, and the system finds its new equilibrium fairly efficiently.
The most important delay in this system is the one that is not under the direct control of the car dealer. It’s the delay in delivery from the factory. But even without the ability to change that part of her system, the dealer can learn to manage inventory quite well.
Delays are pervasive in systems, and they are strong determinants of behavior. Changing the length of a delay may (or may not, depending on the type of delay and the relative lengths of other delays) make a large change in the behavior of a system.
Changing the delays in a system can make it much easier or much harder to manage. You can see why system thinkers are somewhat fanatic on the subject of delays. We’re always on the alert to see where delays occur in systems, how long they are, whether they are delays in information streams or in physical processes. We can’t begin to understand the dynamic behavior of systems unless we know where and how long the delays are. And we are aware that some delays can be powerful policy levers. Lengthening or shortening them can produce major changes in the behavior of systems.
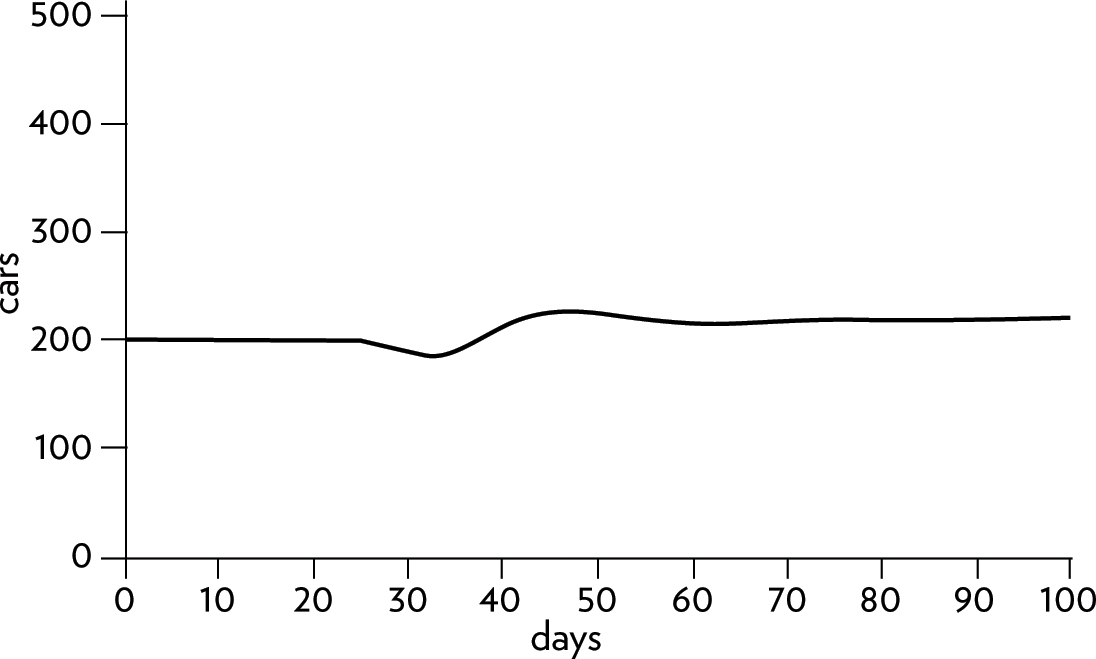
Figure 36. The response of inventory to the same increase in demand with a slowed reaction time.
In the big picture, one store’s inventory problem may seem trivial and fixable. But imagine that the inventory is that of all the unsold automobiles in America. Orders for more or fewer cars affect production not only at assembly plants and parts factories, but also at steel mills, rubber and glass plants, textile producers, and energy producers. Everywhere in this system are perception delays, production delays, delivery delays, and construction delays. Now consider the link between car production and jobs—increased production increases the number of jobs allowing more people to buy cars. That’s a reinforcing loop, which also works in the opposite direction—less production, fewer jobs, fewer car sales, less production. Put in another reinforcing loop, as speculators buy and sell shares in the auto and auto-supply companies based on their recent performance, so that an upsurge in production produces an upsurge in stock price, and vice versa.
That very large system, with interconnected industries responding to each other through delays, entraining each other in their oscillations, and being amplified by multipliers and speculators, is the primary cause of business cycles. Those cycles don’t come from presidents, although presidents can do much to ease or intensify the optimism of the upturns and the pain of the downturns. Economies are extremely complex systems; they are full of balancing feedback loops with delays, and they are inherently oscillatory.5
Two-Stock Systems
A Renewable Stock Constrained by a Nonrenewable Stock—an Oil Economy
The systems I’ve displayed so far have been free of constraints imposed by their surroundings. The capital stock of the industrial economy model didn’t require raw materials to produce output. The population didn’t need food. The thermostat-furnace system never ran out of oil. These simple models of the systems have been able to operate according to their unconstrained internal dynamics, so we could see what those dynamics are.
But any real physical entity is always surrounded by and exchanging things with its environment. A corporation needs a constant supply of energy and materials and workers and managers and customers. A growing corn crop needs water and nutrients and protection from pests. A population needs food and water and living space, and if it’s a human population, it needs jobs and education and health care and a multitude of other things. Any entity that is using energy and processing materials needs a place to put its wastes, or a process to carry its wastes away.
Therefore, any physical, growing system is going to run into some kind of constraint, sooner or later. That constraint will take the form of a balancing loop that in some way shifts the dominance of the reinforcing loop driving the growth behavior, either by strengthening the outflow or by weakening the inflow.
Growth in a constrained environment is very common, so common that systems thinkers call it the “limits-to-growth” archetype. (We’ll explore more archetypes—frequently found system structures that produce familiar behavior patterns—in Chapter Five.) Whenever we see a growing entity, whether it be a population, a corporation, a bank account, a rumor, an epidemic, or sales of a new product, we look for the reinforcing loops that are driving it and for the balancing loops that ultimately will constrain it. We know those balancing loops are there, even if they are not yet dominating the system’s behavior, because no real physical system can grow forever. Even a hot new product will saturate the market eventually. A chain reaction in a nuclear power plant or bomb will run out of fuel. A virus will run out of susceptible people to infect. An economy may be constrained by physical capital or monetary capital or labor or markets or management or resources or pollution.
In physical, exponentially growing systems, there must be at least one reinforcing loop driving the growth and at least one balancing loop constraining the growth, because no physical system can grow forever in a finite environment.
Like resources that supply the inflows to a stock, a pollution constraint can be renewable or nonrenewable. It’s nonrenewable if the environment has no capacity to absorb the pollutant or make it harmless. It’s renewable if the environment has a finite, usually variable, capacity for removal. Everything said here about resource-constrained systems, therefore, applies with the same dynamics but opposite flow directions to pollution-constrained systems.
The limits on a growing system may be temporary or permanent. The system may find ways to get around them for a short while or a long while, but eventually there must come some kind of accommodation, the system adjusting to the constraint, or the constraint to the system, or both to each other. In that accommodation come some interesting dynamics.
Whether the constraining balancing loops originate from a renewable or nonrenewable resource makes some difference, not in whether growth can continue forever, but in how growth is likely to end.
Let’s look, to start, at a capital system that makes its money by extracting a nonrenewable resource—say an oil company that has just discovered a huge new oil field. See Figure 37.
The diagram in Figure 37 may look complicated, but it’s no more than a capital-growth system like the one we’ve already seen, using “profit” instead of “output.” Driving depreciation is the now-familiar balancing loop: the more capital stock, the more machines and refineries there are that fall apart and wear out, reducing the stock of capital. In this example, the capital stock of oil drilling and refining equipment depreciates with a 20-year lifetime—meaning 1/20 (or 5 percent) of the stock is taken out of commission each year. It builds itself up through investment of profits from oil extraction. So we see the reinforcing loop: More capital allows more resource extraction, creating more profits that can be reinvested. I’ve assumed that the company has a goal of 5 percent annual growth in its business capital. If there isn’t enough profit for 5 percent growth, the company invests whatever profits it can.
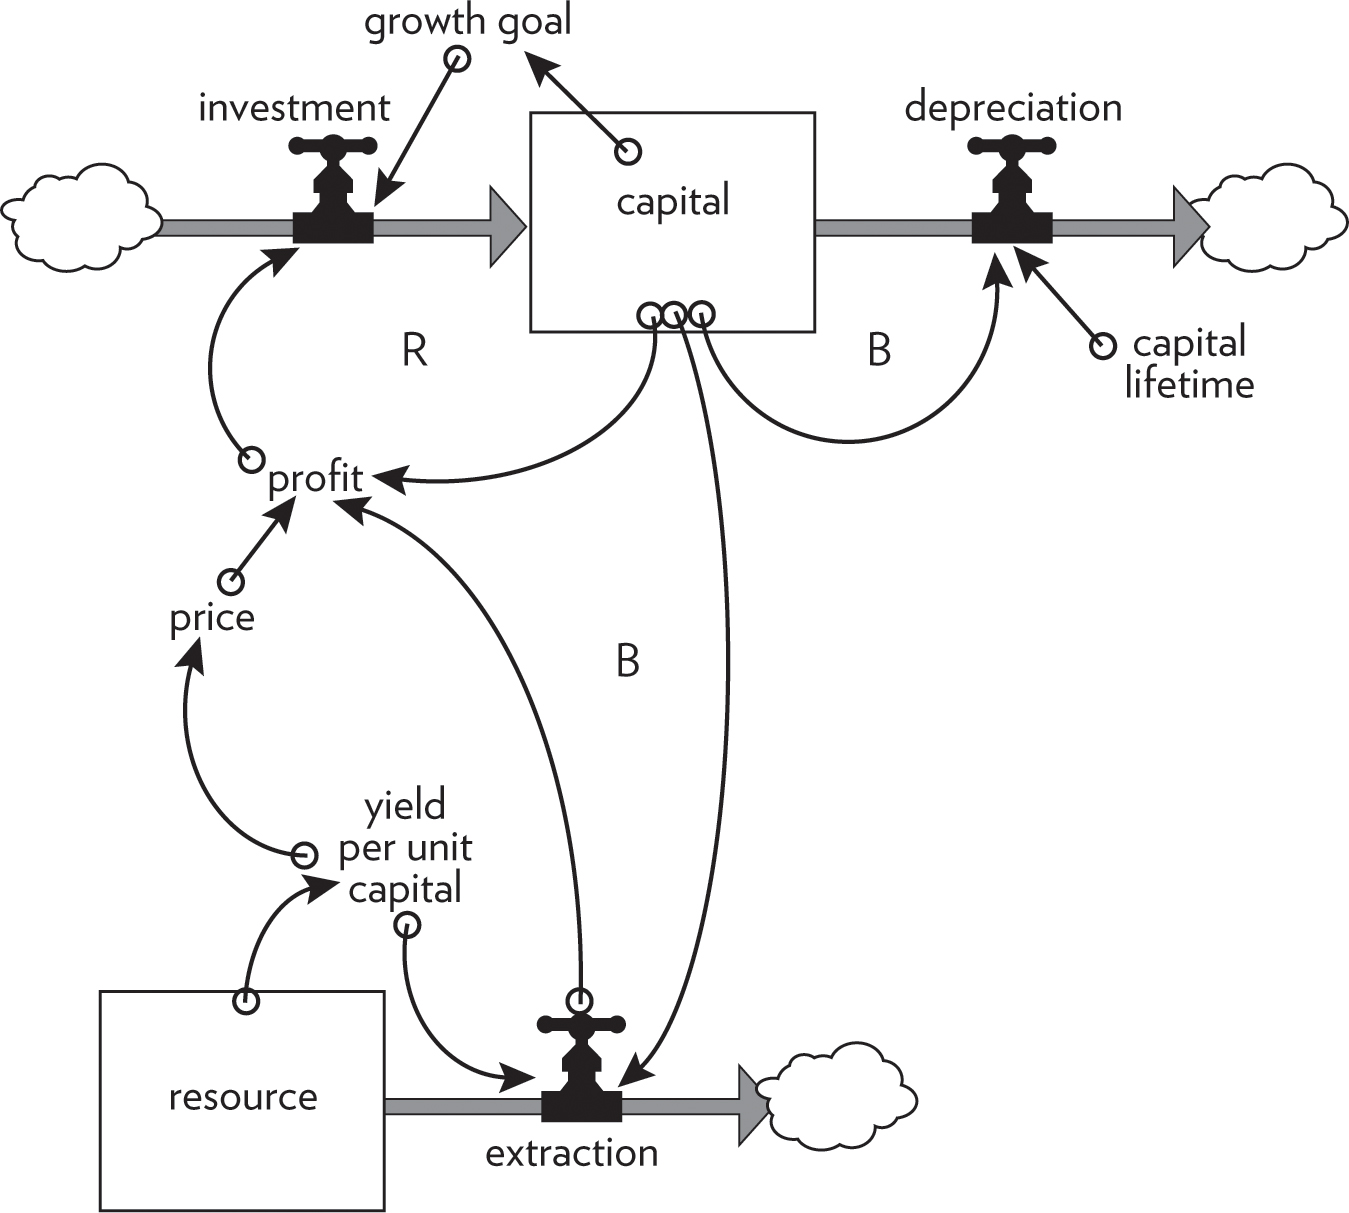
Figure 37. Economic capital, with its reinforcing growth loop constrained by a nonrenewable resource.
Profit is income minus cost. Income in this simple representation is just the price of oil times the amount of oil the company extracts. Cost is equal to capital times the operating cost (energy, labor, materials, etc.) per unit of capital. For the moment, I’ll make the simplifying assumptions that both price and operating cost per unit of capital are constant.
What is not assumed to be constant is the yield of resource per unit of capital. Because this resource is not renewable, as in the case of oil, the stock feeding the extraction flow does not have an input. As the resource is extracted—as an oil well is depleted—the next barrel of oil becomes harder to get. The remaining resource is deeper down, or more dilute, or in the case of oil, under less natural pressure to force it to the surface. More and more costly and technically sophisticated measures are required to keep the resource coming.
Here is a new balancing feedback loop that ultimately will control the growth of capital: the more capital, the higher the extraction rate. The higher the extraction rate, the lower the resource stock. The lower the resource stock, the lower the yield of resource per unit of capital, so the lower the profit (with price assumed constant) and the lower the investment rate—therefore, the lower the rate of growth of capital. I could assume that resource depletion feeds back through operating cost as well as capital efficiency. In the real world it does both. In either case, the ensuing behavior pattern is the same—the classic dynamics of depletion (see Figure 38).
The system starts out with enough oil in the underground deposit to supply the initial scale of operation for 200 years. But, actual extraction peaks at about 40 years because of the surprising effect of exponential growth in extraction. At an investment rate of 10 percent per year, the capital stock and therefore the extraction rate both grow at 5 percent per year and so double in the first 14 years. After 28 years, while the capital stock has quadrupled, extraction is starting to lag because of falling yield per unit of capital. By year 50 the cost of maintaining the capital stock has overwhelmed the income from resource extraction, so profits are no longer sufficient to keep investment ahead of depreciation. The operation quickly shuts down, as the capital stock declines. The last and most expensive of the resource stays in the ground; it doesn’t pay to get it out.
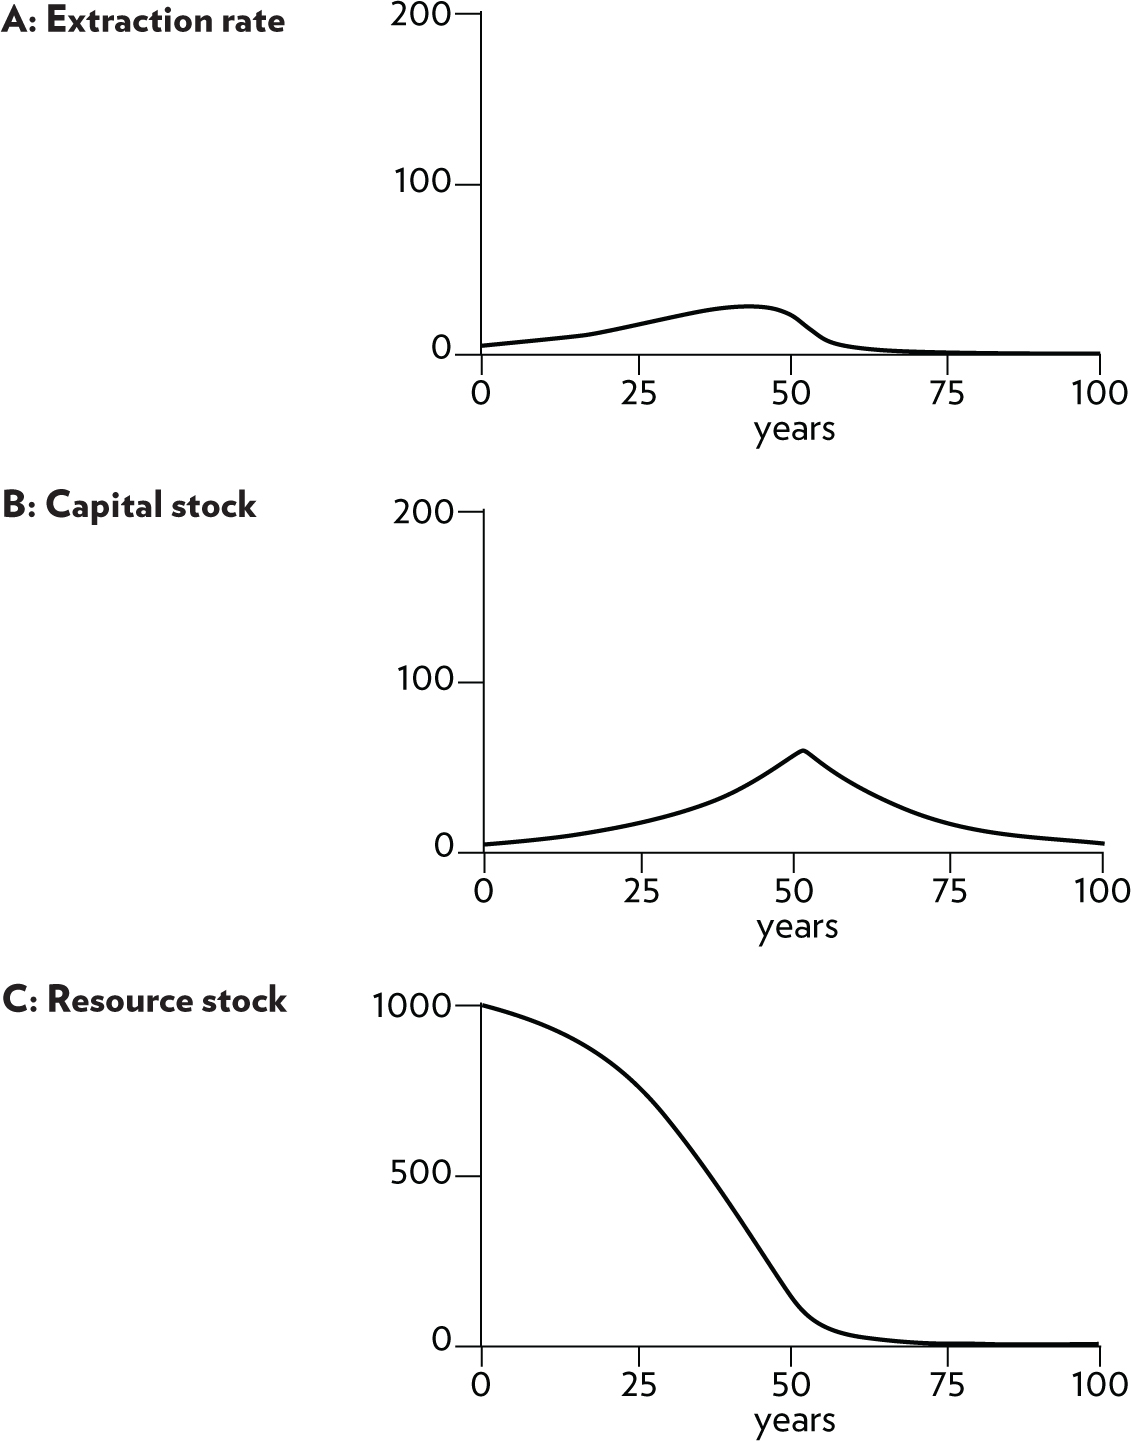
Figure 38. Extraction (A) creates profits that allow for growth of capital (B) while depleting the nonrenewable resource (C). The greater the accumulation of capital, the faster the resource is depleted.
What happens if the original resource turns out to be twice as large as the geologists first thought—or four times as large? Of course, that makes a huge difference in the total amount of oil that can be extracted from this field. But with the continued goal of 10 percent per year reinvestment producing 5 percent per year capital growth, each doubling of the resource makes a difference of only about 14 years in the timing of the peak extraction rate, and in the lifetime of any jobs or communities dependent on the extraction industry (see Figure 39).
A quantity growing exponentially toward a constraint or limit reaches that limit in a surprisingly short time.
The higher and faster you grow, the farther and faster you fall, when you’re building up a capital stock dependent on a nonrenewable resource. In the face of exponential growth of extraction or use, a doubling or quadrupling of the nonrenewable resource give little added time to develop alternatives.
If your concern is to extract the resource and make money at the maximum possible rate, then the ultimate size of the resource is the most important number in this system. If, say, you’re a worker at the mine or oil field, and your concern is with the lifetime of your job and stability of your community, then there are two important numbers: the size of the resource and the desired growth rate of capital. (Here is a good example of the goal of a feedback loop being crucial to the behavior of a system.) The real choice in the management of a nonrenewable resource is whether to get rich very fast or to get less rich but stay that way longer.
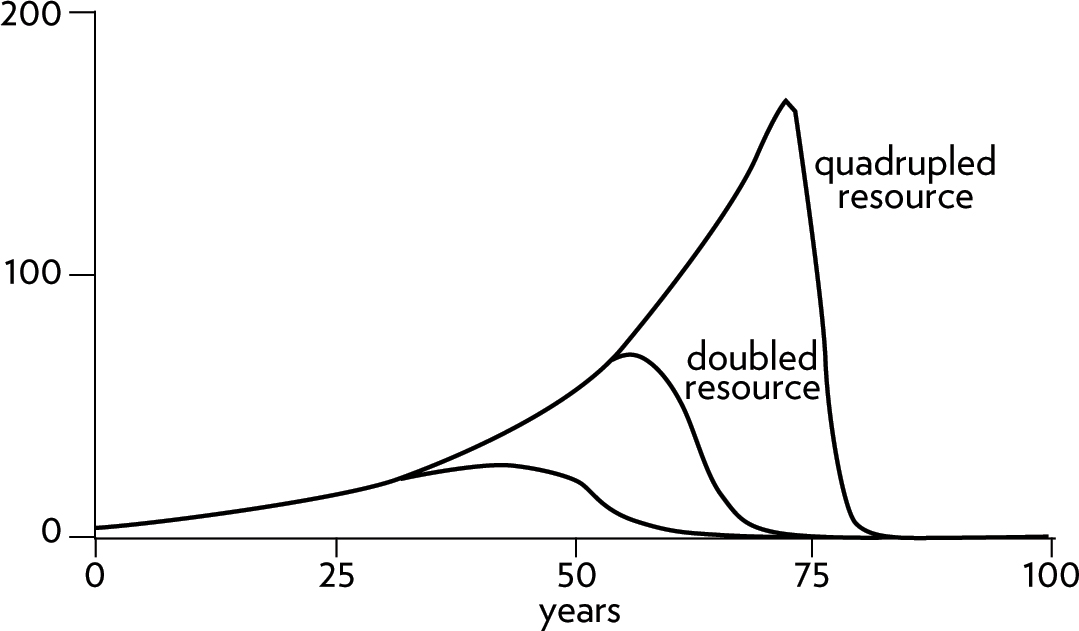
Figure 39. Extraction with two times or four times as large a resource to draw on. Each doubling of the resource makes a difference of only about fourteen years in the peak of extraction.
The graph in Figure 40 shows the development of the extraction rate over time, given desired growth rates above depreciation varying from 1 percent annually, to 3 percent, 5 percent, and 7 percent. With a 7 percent growth rate, extraction of this “200-year supply” peaks within 40 years. Imagine the effects of this choice not only on the profits of the company, but on the social and natural environments of the region.
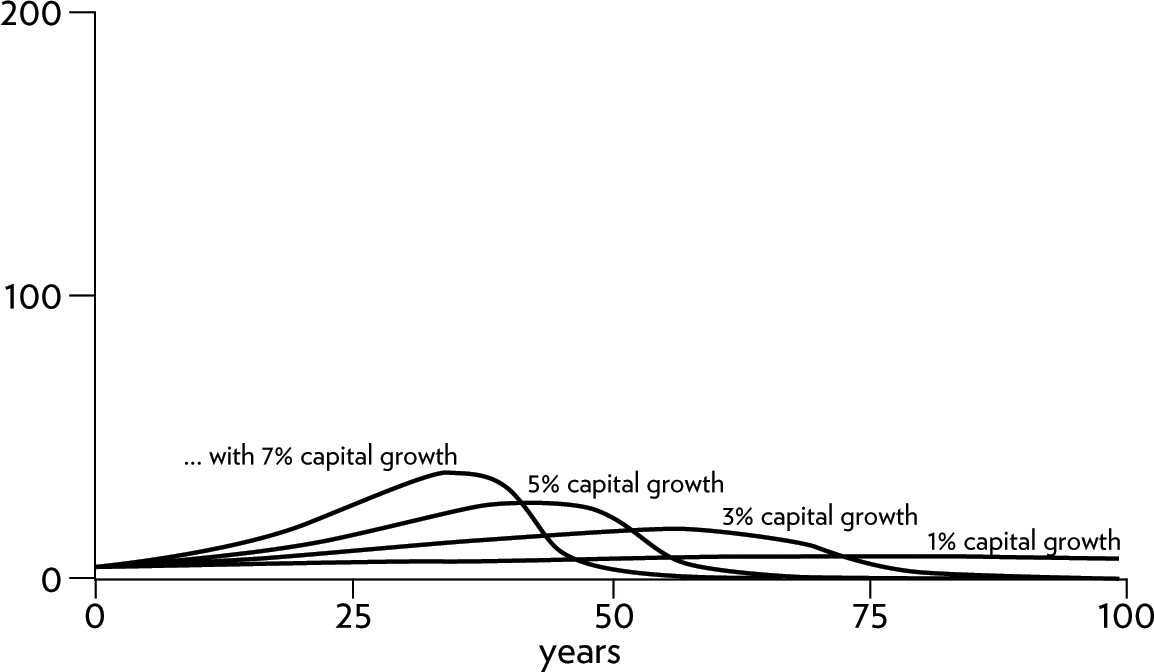
Figure 40. The peak of extraction comes much more quickly as the fraction of profits reinvested increases.
Earlier I said I would make the simplifying assumption that price was constant. But what if that’s not true? Suppose that in the short term the resource is so vital to consumers that a higher price won’t decrease demand. In that case, as the resource gets scarce and price rises steeply, as shown in Figure 41.
The higher price gives the industry higher profits, so investment goes up, capital stock continues rising, and the more costly remaining resources can be extracted. If you compare Figure 41 with Figure 38, where price was held constant, you can see that the main effect of rising price is to build the capital stock higher before it collapses.
The same behavior results, by the way, if prices don’t go up but if technology brings operating costs down—as has actually happened, for example, with advanced recovery techniques from oil wells, with the beneficiation process to extract low-grade taconite from exhausted iron mines, and with the cyanide leaching process that allows profitable extraction even from the tailings of gold and silver mines.
We all know that individual mines and fossil fuel deposits and groundwater aquifers can be depleted. There are abandoned mining towns and oil fields all over the world to testify to the reality of the behavior we’ve seen here. Resource companies understand this dynamic too. Well before depletion makes capital less efficient in one place, companies shift investment to discovery and development of another deposit somewhere else. But, if there are local limits, eventually will there be global ones?
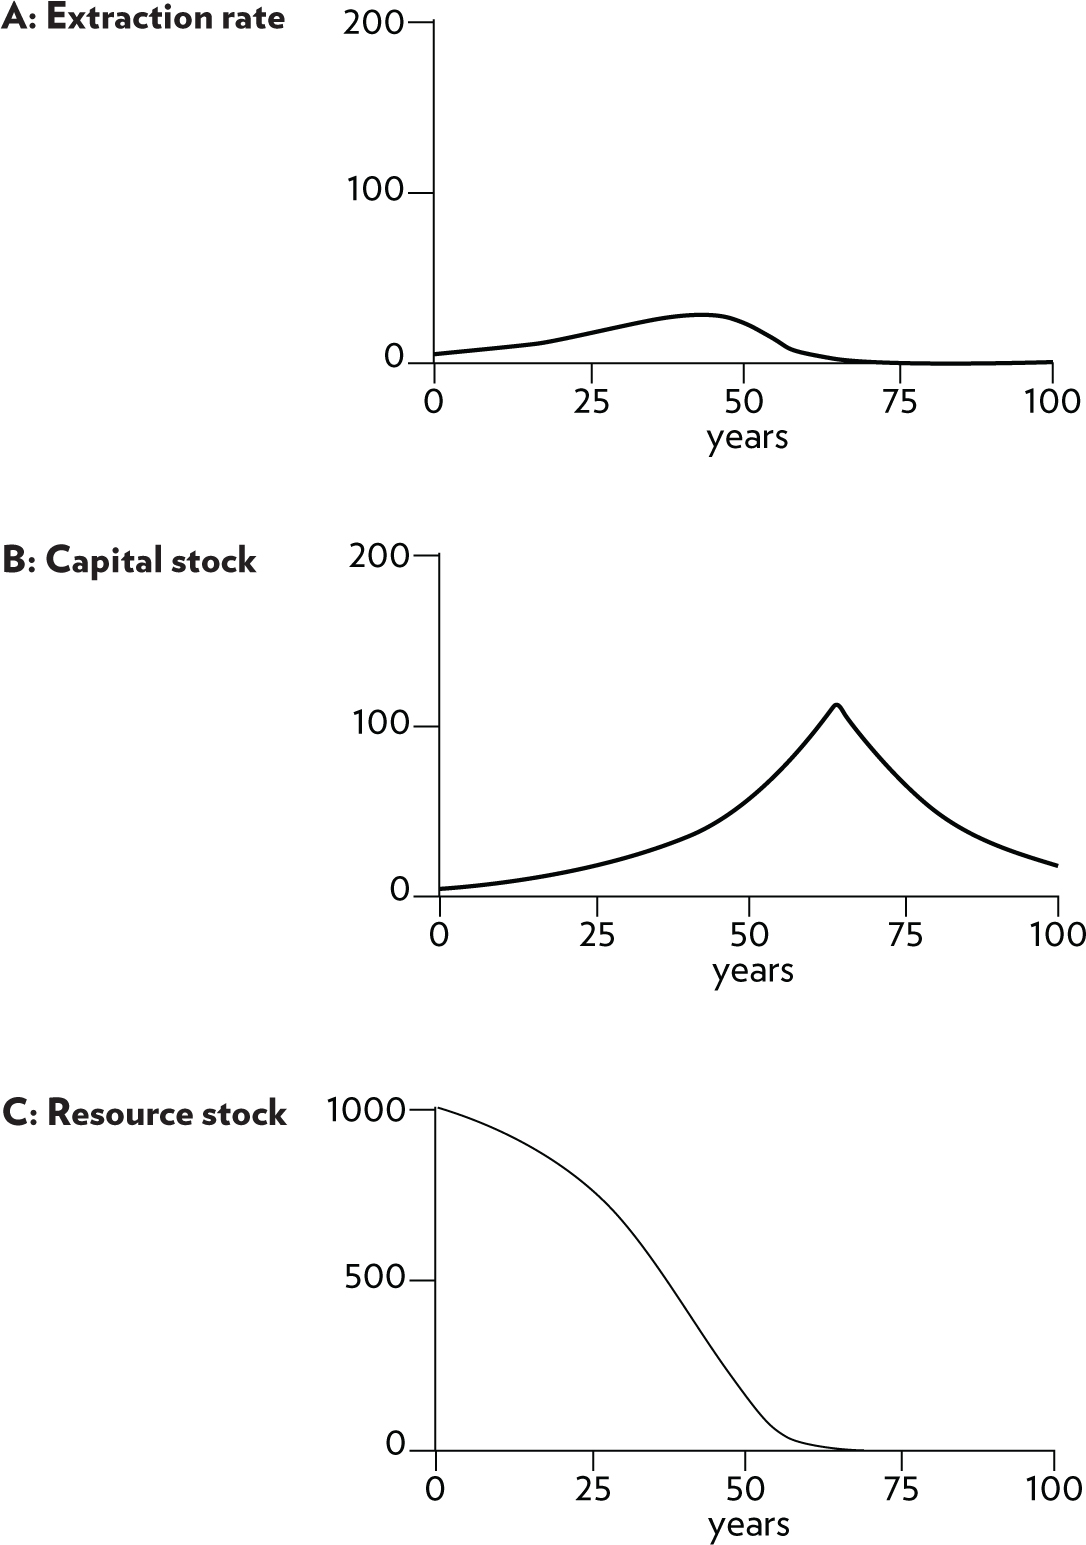
Figure 41. As price goes up with increasing scarcity, there is more profit to reinvest, and the capital stock can grow larger (B) driving extraction up for longer (A). The consequence is that the resource (C) is depleted even faster at the end.
I’ll leave you to have this argument with yourself, or with someone of the opposite persuasion. I will just point out that, according to the dynamics of depletion, the larger the stock of initial resources, the more new discoveries, the longer the growth loops elude the control loops, and the higher the capital stock and its extraction rate grow, and the earlier, faster, and farther will be the economic fall on the back side of the production peak.
Unless, perhaps, the economy can learn to operate entirely from renewable resources.
When to use it
Managing inventory in a retail supply chain with long lead times.
Setting production rates for a depletable resource like an oil field or mine.
Adjusting response times in a feedback system, such as when to react to market changes.
Understanding the impact of growth targets on the sustainability of a resource-dependent business.
FROM THEORY TO EVERYDAY LIFE
In practice
Car Dealership Inventory with Delays
A car dealership maintains inventory to cover 10 days of sales. When a permanent 10% increase in demand occurs, the dealer perceives the change with a delay (averaging over 5 days), responds gradually (adjusting orders over 3 days), and faces delivery delays (5 days). These delays cause inventory to oscillate before settling. Attempts to shorten reaction time (from 3 to 2 days) worsen oscillations, while lengthening reaction time (to 6 days) dampens them.
Oil Extraction with Growth and Depletion
An oil company discovers a field with a 200-year supply at current extraction rates. However, with a goal of 5% annual growth in capital, extraction peaks around 40 years due to exponential growth. Doubling or quadrupling the resource only extends the peak by about 14 years. Faster growth (7%) leads to an even earlier peak. Rising prices or technology can temporarily boost extraction but ultimately accelerate decline.
A MOMENT TO REFLECT
Put it to work.
Think of a system you interact with where delays in feedback cause oscillations. How could you lengthen the response delay to improve stability?
In a business context, consider how the growth rate of capital affects the longevity of a nonrenewable resource operation. What would happen if the goal were to maximize total profit over time instead of growth?
How can you identify the most influential delay in a system and adjust it to improve behavior?
Often confused with
CONTINUE THE CONVERSATION
Source texts
- Thinking in Systems A Primer