A Stock with One Reinforcing Loop and One Balancing Loop—Population and Industrial Economy
A stock grows when inflow exceeds outflow, shrinks when outflow exceeds inflow, and stays constant when they balance. Population and industrial capital illustrate how reinforcing and balancing feedback loops produce these patterns, and how the pattern changes when the relative strength of the loops changes.
THE IDEA
A Stock with One Reinforcing Loop and One Balancing Loop—Population and Industrial Economy
What happens when a reinforcing and a balancing loop are both pulling on the same stock? This is one of the most common and important system structures. It captures one part of the behavior of populations and economies.
In this simplified population model, births reinforce growth and deaths balance it. The rates below initially mean births and deaths per person in the population, rather than children per woman.
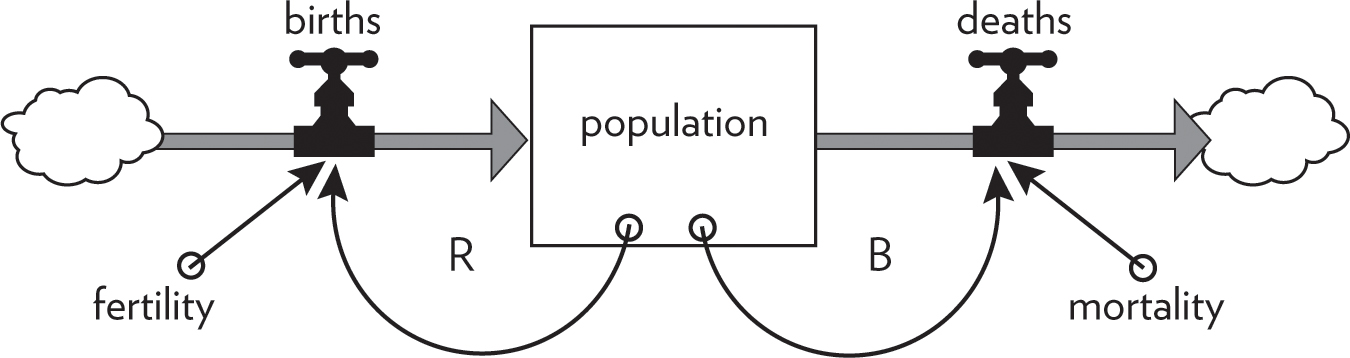
Figure 21. Population governed by a reinforcing loop of births and a balancing loop of deaths.
As long as fertility and mortality are constant (which in real systems they rarely are), this system has a simple behavior. It grows exponentially or dies off, depending on whether its reinforcing feedback loop determining births is stronger than its balancing feedback loop determining deaths.
For example, the 2007 world population of 6.6 billion people had a fertility rate of roughly 21 births a year for every 1,000 people in the population. Its mortality rate was 9 deaths a year out of every 1,000 people. Fertility was higher than mortality, so the reinforcing loop dominated the system. If those fertility and mortality rates continue unchanged, a child born at that time would see the world population more than double by the time he or she reaches the age of 60, as shown in Figure 22.
If, because of a terrible disease, the mortality rate were higher, say at 30 deaths per 1,000, while the fertility rate remained at 21, then the death loop would dominate the system. More people would die each year than would be born, and the population would gradually decrease (Figure 23).
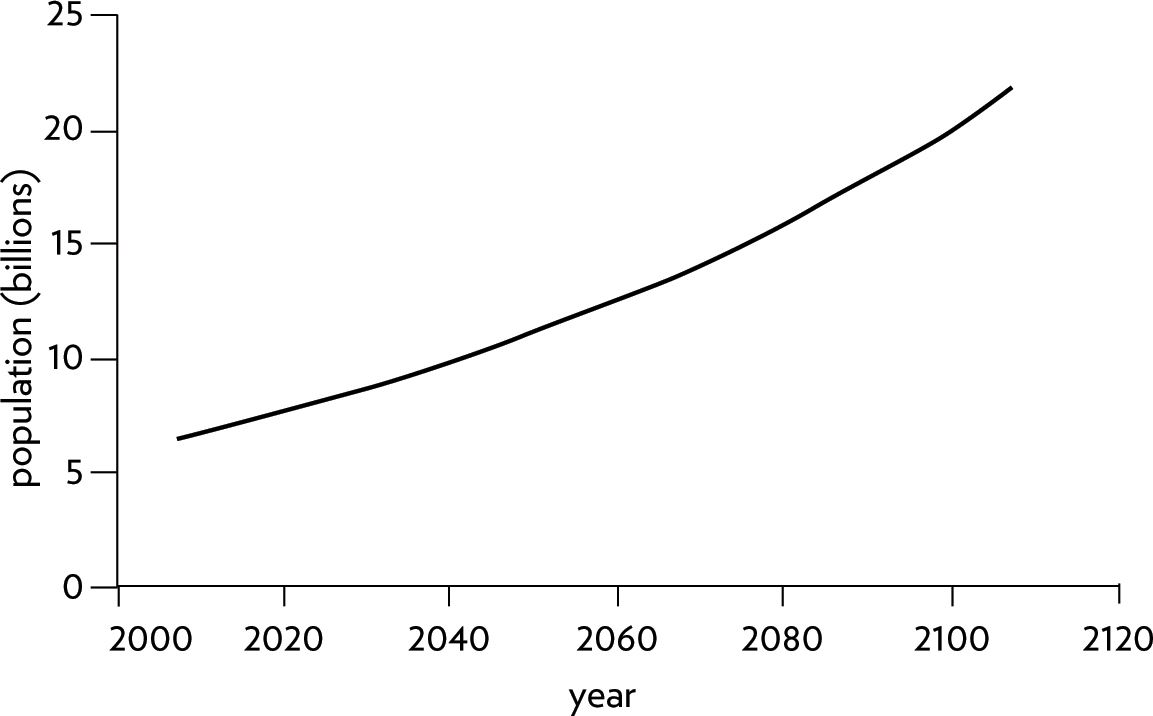
Figure 22. Population growth if fertility and mortality maintain their 2007 levels of 21 births and nine deaths per 1,000 people.
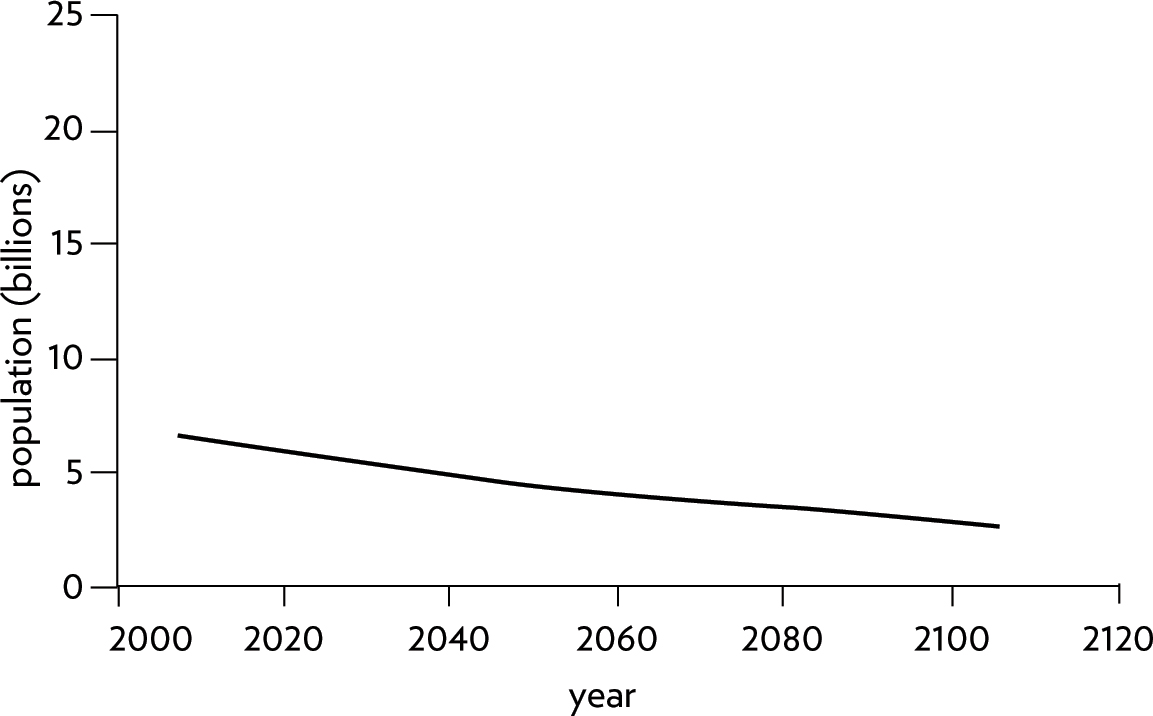
Figure 23. Population decline if fertility remains at 2007 level (21 births per 1,000) but mortality is much higher, 30 deaths per 1,000.
Things get more interesting when birth and death rates change over time. The book discusses United Nations projections that assumed declining fertility as countries developed, tending toward an average of 1.85 children per woman. That was a projection assumption, not a universal replacement level. The mortality assumptions discussed here also belonged to that period: declines were expected to continue more slowly, with HIV/AIDS slowing increases in life expectancy in affected regions over the following fifty years.
Changing flows (fertility and mortality) create a change in the behavior over time of the stock (population)—the line bends. If, for example, world fertility falls steadily to equal mortality by the year 2035 and they both stay constant thereafter, the population will level off, births exactly balancing deaths in dynamic equilibrium, as in Figure 24.
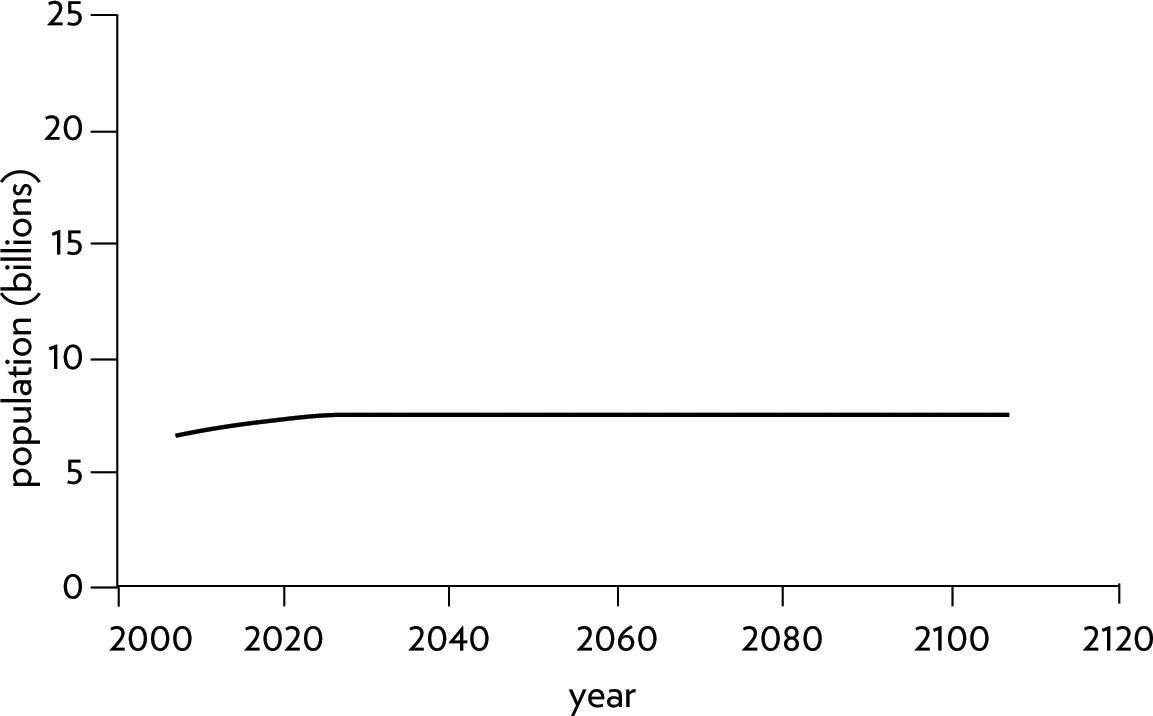
Figure 24. Population stabilizes when fertility equals mortality.
This behavior is an example of shifting dominance of feedback loops. Dominance is an important concept in systems thinking. When one loop dominates another, it has a stronger impact on behavior. Because systems often have several competing feedback loops operating simultaneously, those loops that dominate the system will determine the behavior.
At first, when fertility is higher than mortality, the reinforcing growth loop dominates the system and the resulting behavior is exponential growth. But that loop is gradually weakened as fertility falls. Finally, it exactly equals the strength of the balancing loop of mortality. At that point neither loop dominates, and we have dynamic equilibrium.
A thermostat system offers another example. If falling outside temperatures increase heat loss beyond what the furnace can replace, the room cools despite the heating system. The relative strength of the heat-input and heat-loss processes has changed.
Complex behaviors of systems often arise as the relative strengths of feedback loops shift, causing first one loop and then another to dominate behavior.
There are only a few ways a population system could behave, and these depend on what happens to the “driving” variables, fertility and mortality. These are the only ones possible for a simple system of one reinforcing and one balancing loop. A stock governed by linked reinforcing and balancing loops will grow exponentially if the reinforcing loop dominates the balancing one. It will die off if the balancing loop dominates the reinforcing one. It will level off if the two loops are of equal strength (see Figure 25). Or it will do a sequence of these things, one after another, if the relative strengths of the two loops change over time (see Figure 26).
I chose some provocative population scenarios here to illustrate a point about models and the scenarios they can generate. Whenever you are confronted with a scenario (and you are, every time you hear about an economic prediction, a corporate budget, a weather forecast, future climate change, a stockbroker saying what is going to happen to a particular holding), there are questions you need to ask that will help you decide how good a representation of reality is the underlying model.
- Are the driving factors likely to unfold this way? (What are birth rate and death rate likely to do?)
- If they did, would the system react this way? (Do birth and death rates really cause the population stock to behave as we think it will?)
- What is driving the driving factors? (What affects birth rate? What affects death rate?)
The first question can’t be answered factually. It’s a guess about the future, and the future is inherently uncertain. Although you may have a strong opinion about it, there’s no way to prove you’re right until the future actually happens. A systems analysis can test a number of scenarios to see what happens if the driving factors do different things. That’s usually one purpose of a systems analysis. But you have to be the judge of which scenario, if any, should be taken seriously as a future that might really be possible.
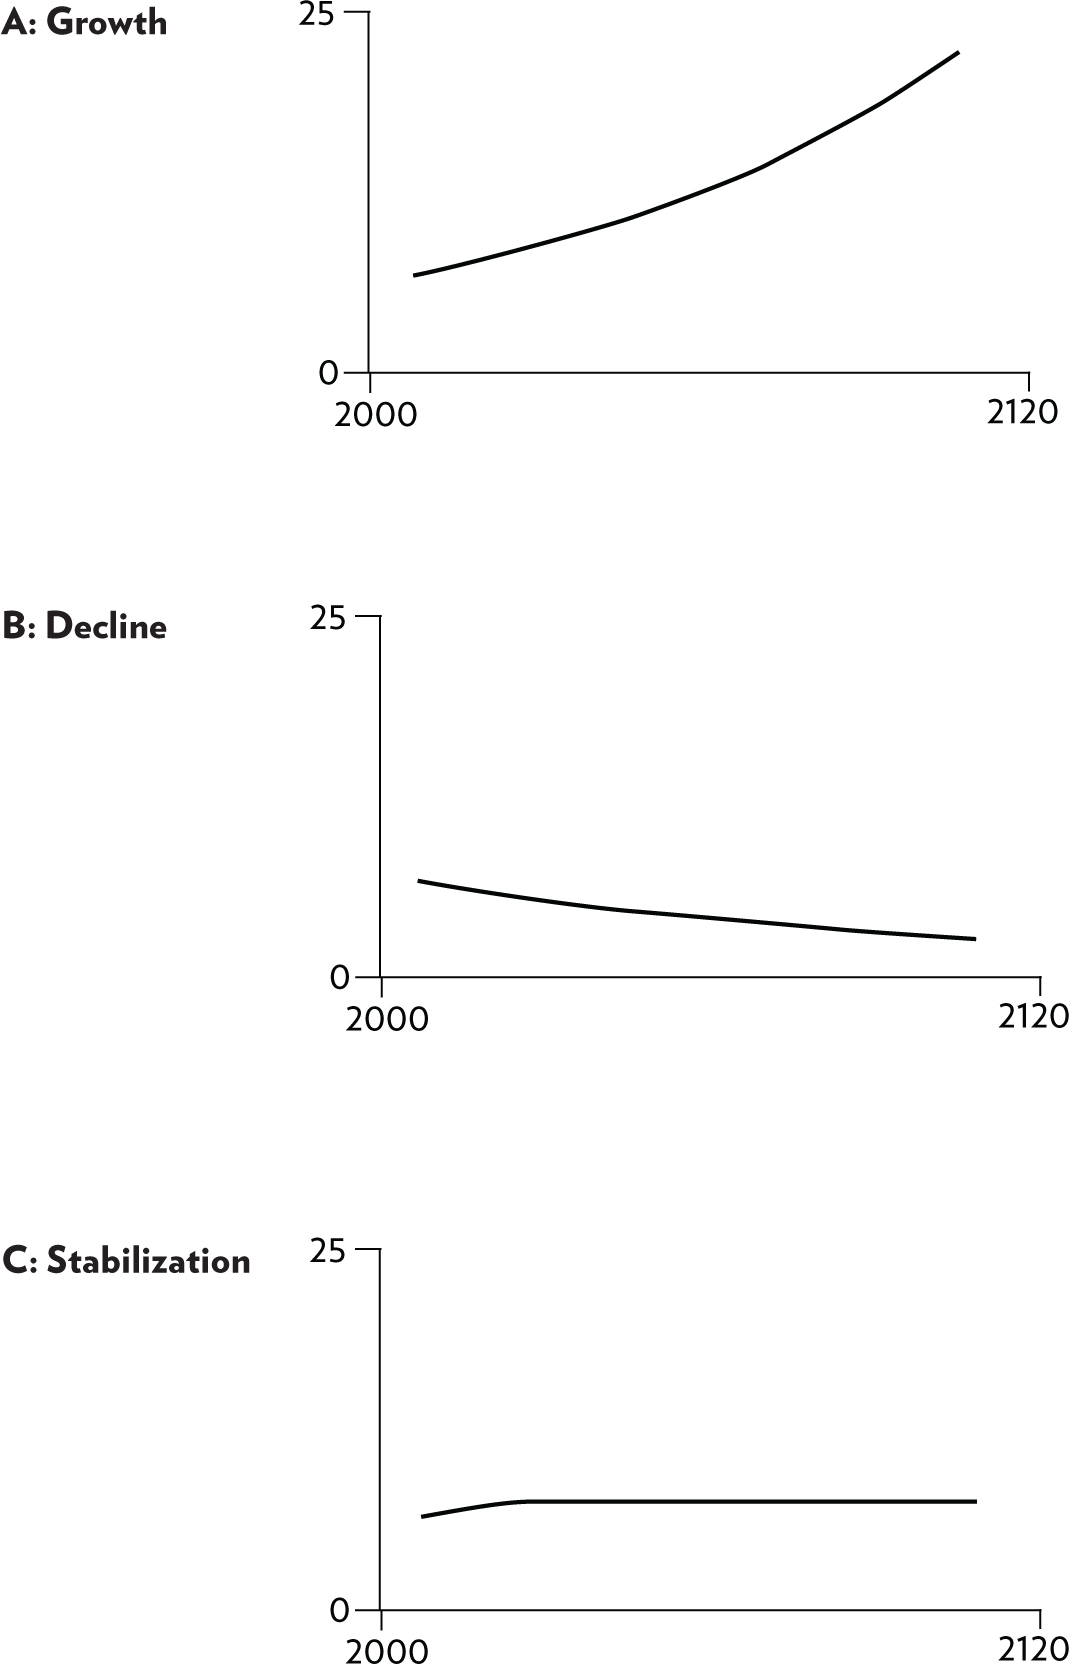
Figure 25. Three possible behaviors of a population: growth, decline, and stabilization.
Dynamic systems studies usually are not designed to predict what will happen. Rather, they’re designed to explore what would happen, if a number of driving factors unfold in a range of different ways.
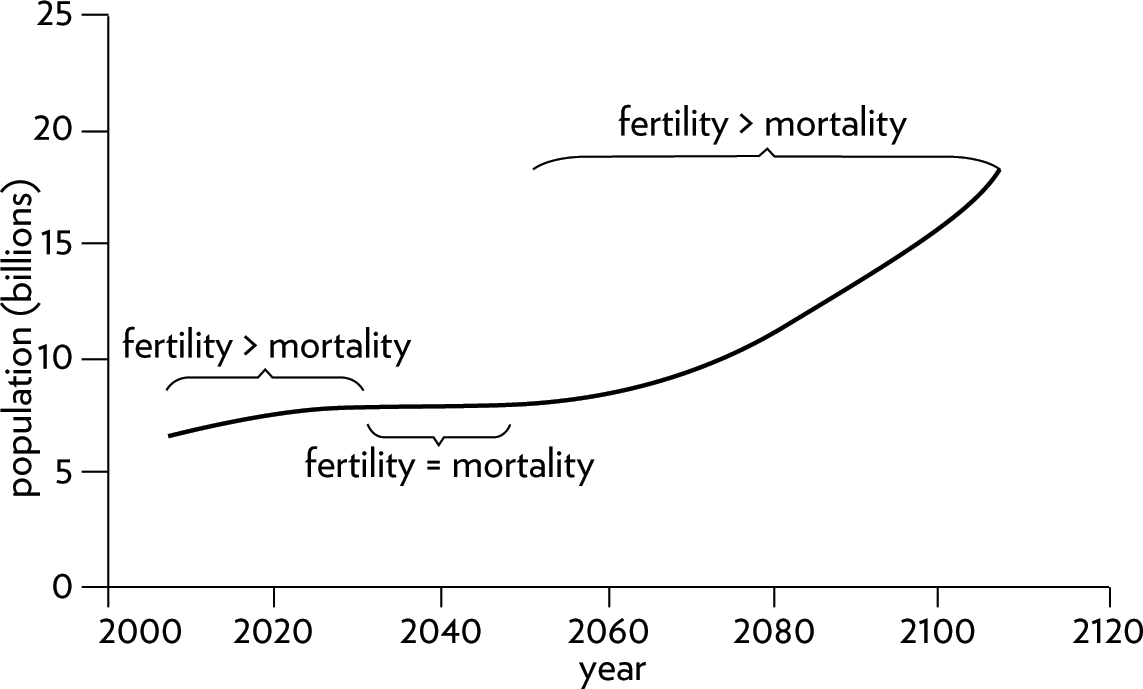
Figure 26. Shifting dominance of fertility and mortality loops.
The second question—whether the system really will react this way—is more scientific. It’s a question about how good the model is. Does it capture the inherent dynamics of the system? Regardless of whether you think the driving factors will do that, would the system behave like that if they did?
In the population scenarios above, however likely you think they are, the answer to this second question is roughly yes, the population would behave like this, if the fertility and mortality did that. The population model I have used here is very simple. A more detailed model would distinguish age groups, for example. But basically this model responds the way a real population would, growing under the conditions when a real population would grow, declining when a real population would decline. The numbers are off, but the basic behavior pattern is realistic.
System dynamics models explore possible futures and ask “what if” questions.
Finally, there is the third question. What is driving the driving factors? What is adjusting the inflows and outflows? This is a question about system boundaries. It requires a hard look at those driving factors to see if they are actually independent, or if they are also embedded in the system.
QUESTIONS FOR TESTING THE VALUE OF A MODEL
Are the driving factors likely to unfold this way?If they did, would the system react this way?What is driving the driving factors?
Is there anything about the size of the population, for instance, that might feed back to influence fertility or mortality? Do other factors—economics, the environment, social trends—influence fertility and mortality? Does the size of the population affect those economic and environmental and social factors?
Model utility depends not on whether its driving scenarios are realistic (since no one can know that for sure), but on whether it responds with a realistic pattern of behavior.
Of course, the answer to all of these questions is yes. Fertility and mortality are governed by feedback loops too. At least some of those feedback loops are themselves affected by the size of the population. This population “animal” is only one piece of a much larger system.3
One important piece of the larger system that affects population is the economy. At the heart of the economy is another reinforcing-loop-plus-balancing-loop system—the same kind of structure, with the same kinds of behavior, as the population (see Figure 27).
The greater the stock of physical capital (machines and factories) in the economy and the efficiency of production (output per unit of capital), the more output (goods and services) can be produced each year.
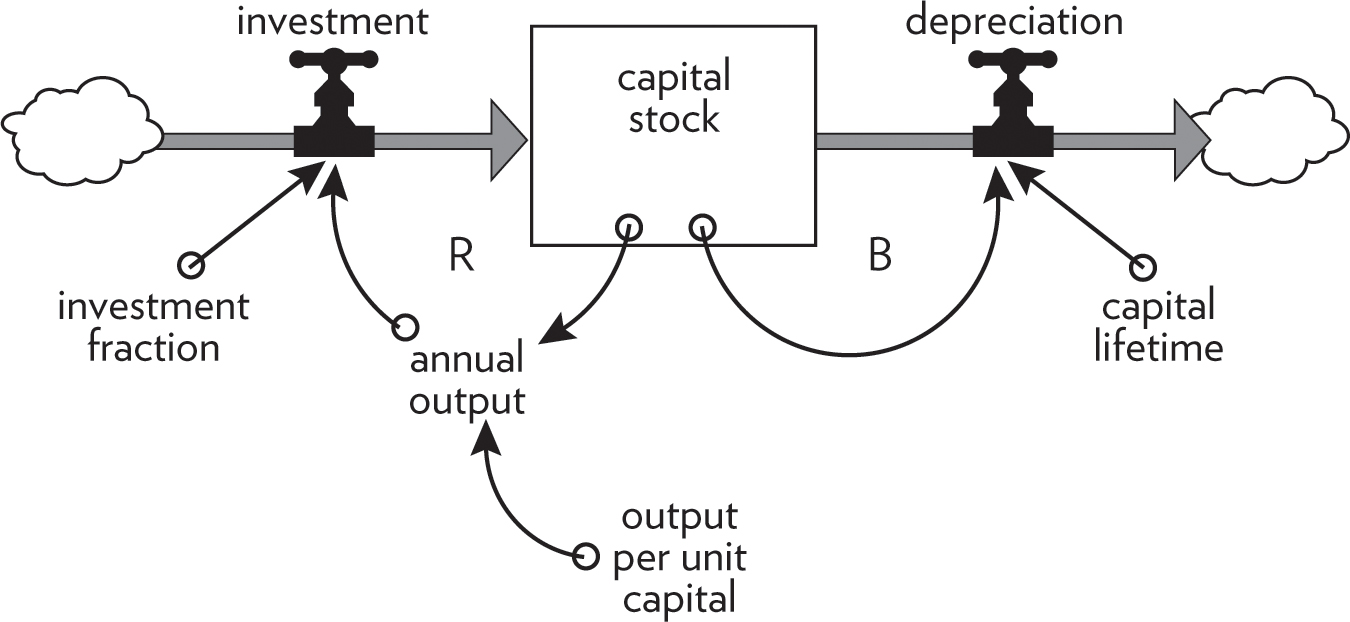
Figure 27. Like a living population, economic capital has a reinforcing loop (investment of output) governing growth and a balancing loop (depreciation) governing decline.
The more output that is produced, the more can be invested to make new capital. This is a reinforcing loop, like the birth loop for a population. The investment fraction is equivalent to the fertility. The greater the fraction of its output a society invests, the faster its capital stock will grow.
Physical capital is drained by depreciation—obsolescence and wearing-out. The balancing loop controlling depreciation is equivalent to the death loop in a population. The “mortality” of capital is determined by the average capital lifetime. The longer the lifetime, the smaller the fraction of capital that must be retired and replaced each year.
If this system has the same structure as the population system, it must have the same repertoire of behaviors. In the historical growth pattern discussed in the book, the reinforcing loop of world capital, like that of world population, had dominated. Whether in the future it grows or stays constant or dies off depends on whether its reinforcing growth loop remains stronger than its balancing depreciation loop. That depends on
- the investment fraction—how much output the society invests rather than consumes,
- the efficiency of capital—how much capital it takes to produce a given amount of output, and
- the average capital lifetime.
If a constant fraction of output is reinvested in the capital stock and the efficiency of that capital (its ability to produce output) is also constant, the capital stock may decline, stay constant, or grow, depending on the lifetime of the capital. The lines in Figure 28 show systems with different average capital lifetimes. With a relatively short lifetime, the capital wears out faster than it is replaced. Reinvestment does not keep up with depreciation and the economy slowly declines. When depreciation just balances investment, the economy is in dynamic equilibrium. With a long lifetime, the capital stock grows exponentially. The longer the lifetime of capital, the faster it grows.
This is another example of a principle we’ve already encountered: You can make a stock grow by decreasing its outflow rate as well as by increasing its inflow rate!
Just as many factors influence the fertility and mortality of a population, so many factors influence the output ratio, investment fraction, and the lifetime of capital—interest rates, technology, tax policy, consumption habits, and prices, to name just a few. Population itself influences investment, both by contributing labor to output, and by increasing demands on consumption, thereby decreasing the investment fraction. Economic output also feeds back to influence population in many ways. A richer economy usually has better health care and a lower death rate. A richer economy also usually has a lower birth rate.
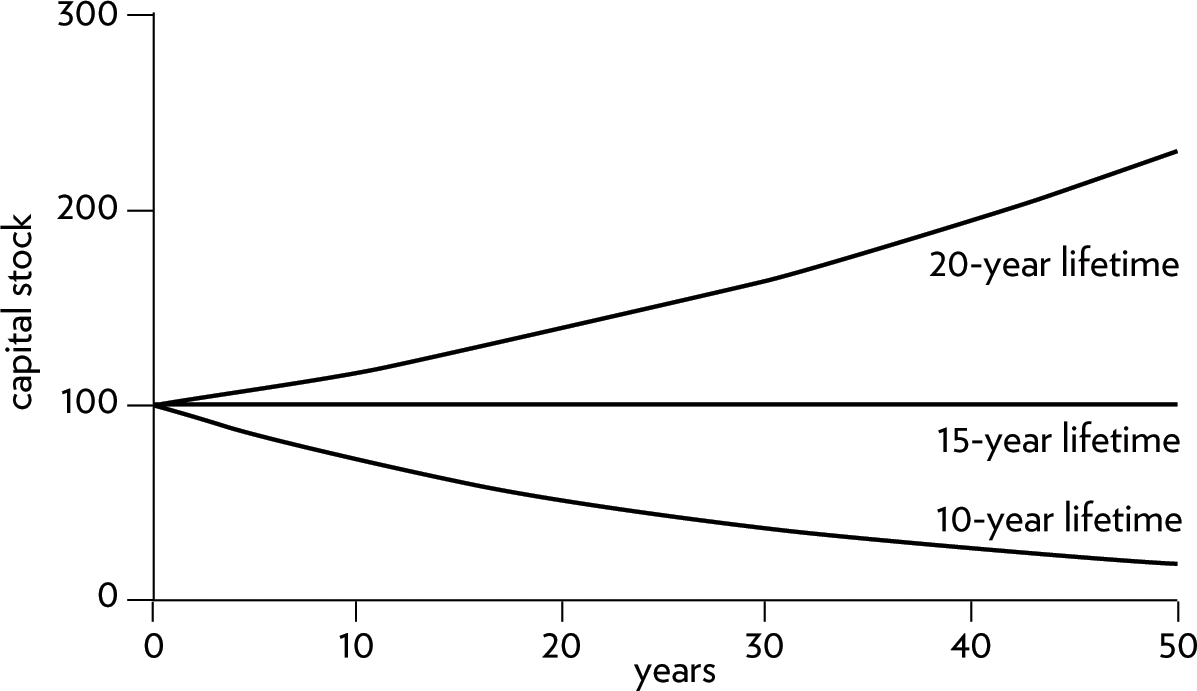
Figure 28. Growth in capital stock with changes in the lifetime of the capital. In a system with output per unit capital ratio of 1:3 and an investment fraction of 20 percent, capital with a lifetime of 15 years just keeps up with depreciation. A shorter lifetime leads to a declining stock of capital.
In fact, just about any long-term model of a real economy should link together the two structures of population and capital to show how they affect each other. The central question of economic development is how to keep the reinforcing loop of capital accumulation from growing more slowly than the reinforcing loop of population growth—so that people are getting richer instead of poorer.4
It may seem strange to you that I call the capital system the same kind of “zoo animal” as the population system. A production system with factories and shipments and economic flows doesn’t look much like a population system with babies being born and people aging and having more babies and dying. But from a systems point of view these systems, so dissimilar in many ways, have one important thing in common: their feedback-loop structures. Both have a stock governed by a reinforcing growth loop and a balancing death loop. Both also have an aging process. Steel mills and lathes and turbines get older and die just as people do.
Systems with similar feedback structures produce similar dynamic behaviors.
One of the central insights of systems theory, as central as the observation that systems largely cause their own behavior, is that systems with similar feedback structures produce similar dynamic behaviors, even if the outward appearance of these systems is completely dissimilar.
A population is nothing like an industrial economy, except that both can reproduce themselves out of themselves and thus grow exponentially. And both age and die. A coffee cup cooling is like a warmed room cooling, and like a radioactive substance decaying, and like a population or industrial economy aging and dying. Each declines as the result of a balancing feedback loop.
When to use it
Analyzing population trends and planning for resources
Exploring how investment, production, and depreciation affect a simplified capital stock.
Comparing capital-replacement scenarios as asset lifetimes or investment rates change.
Studying ecological systems with birth and death rates
FROM THEORY TO EVERYDAY LIFE
In practice
Population Growth and Decline
A population has a reinforcing loop (births) and a balancing loop (deaths). With constant fertility of 21 births per 1,000 and mortality of 9 deaths per 1,000, the reinforcing loop dominates, leading to exponential growth. If mortality were higher (30 per 1,000) while fertility remains at 21, the balancing loop dominates, causing population decline. If fertility gradually falls to equal mortality, the population stabilizes.
Industrial Capital Growth and Decline
Physical capital stock has a reinforcing loop (investment from output) and a balancing loop (depreciation). With a constant investment fraction of 20% and output per capital ratio of 1:3, a capital lifetime of 15 years maintains dynamic equilibrium. A shorter lifetime leads to decline, while a longer lifetime leads to exponential growth.
A MOMENT TO REFLECT
Put it to work.
Are the driving factors likely to unfold this way? For a system you observe, what are the key inflows and outflows, and how might they change?
If they did, would the system react this way? Does the model capture the inherent dynamics of the real system?
What is driving the driving factors? What external or feedback influences affect the inflows and outflows?
CONTINUE THE CONVERSATION
Source texts
- Thinking in Systems A Primer